· Zen HuiFer · Case · 5 min read
Smart Water Supply
This article introduces common equipment and statistical schemes in the smart water supply system, including soil temperature and humidity + conductivity sensors, smart water meters, pressure gauges and flow meters, water quality monitoring equipment, and pump station monitoring equipment. Through real-time monitoring and data analysis of these devices, the water supply system can be optimized, agricultural production efficiency can be improved, and water supply safety can be ensured.

Common Equipment
- Soil Temperature and Humidity + Conductivity Sensors: These sensors are a core component of the agricultural intelligent monitoring system, capable of real-time monitoring of soil temperature, humidity, and conductivity. By accurately measuring these key parameters, the sensors can help agricultural practitioners understand soil conditions, thereby more effectively managing irrigation systems to ensure crops grow in optimal environmental conditions. These smart sensors also have remote data transmission capabilities, allowing agricultural practitioners to remotely monitor the growth environment of crops, timely adjust agricultural management measures, and improve the efficiency and sustainability of agricultural production.
- Smart Water Meters: As the basic carrier and sensor of the water IoT, smart water meters are the first step in the intelligent transformation of the water system. They can monitor water usage in real-time and transmit data remotely.
- Pressure Gauges and Flow Meters: These devices can monitor water pressure and flow, which are crucial for optimizing the water supply system and managing leaks.
- Water Quality Monitoring Equipment: Used for real-time monitoring of water quality to ensure water supply safety. Sensors can be added and integrated with NB-IoT standard modules to connect with IoT platforms.
- Pump Station Monitoring Equipment: Monitors the operating status of pump stations, achieving remote monitoring and control through IoT technology.
Common Statistical Schemes
Soil Temperature and Humidity + Conductivity Sensors
- Data Collection: Real-time collection of soil temperature, humidity, and conductivity data from the sensors.
- Temperature and Humidity Conductivity Analysis: Provides trend analysis over time (daily, weekly, monthly, yearly) to aid in intelligent monitoring and early warning.
- Anomaly Detection: Analyzes abnormal patterns in temperature, humidity, and conductivity, such as sudden increases or decreases, and provides timely alerts.
Smart Water Meter Data Analysis
- Data Collection: Real-time collection of water usage data from smart water meters.
- Water Usage Statistics: Statistics on water usage over time (daily, weekly, monthly, yearly) and provides trend analysis.
- Anomaly Detection: Analyzes abnormal patterns in water usage, such as sudden increases or decreases, and provides timely alerts.
Pressure Gauge and Flow Meter Data Analysis
- Real-time Monitoring: Real-time display of water pressure and flow data.
- Pressure and Flow Analysis: Analyzes trends in water pressure and flow to identify potential issues.
- System Optimization: Optimizes the distribution of pressure and flow in the water supply system based on monitoring data.
Water Quality Monitoring Equipment Data Analysis
- Real-time Monitoring: Real-time collection of water quality parameters such as pH, dissolved oxygen, turbidity, etc.
- Water Quality Assessment: Evaluates water quality levels and safety based on water quality parameters.
Water Quality Standards: Standard limits in GB3838-2002
| Class I Water | Class II Water | Class III Water | Class IV Water | Class V Water | |
|---|---|---|---|---|---|
| PH | 6~9 | 6~9 | 6~9 | 6~9 | 6~9 |
| Dissolved Oxygen (≥) | 7.5 | 6 | 5 | 3 | 2 |
| Permanganate Index (≤) | 2 | 4 | 6 | 10 | 15 |
| Ammonia Nitrogen (≤) | 0.15 | 0.5 | 1.0 | 1.5 | 2.0 |
Pump Station Monitoring Equipment Data Analysis
- Operational Status Monitoring: Real-time monitoring of the operational status of pump stations, including current, voltage, power, etc.
Go IoT Implementation Process
Data Collection
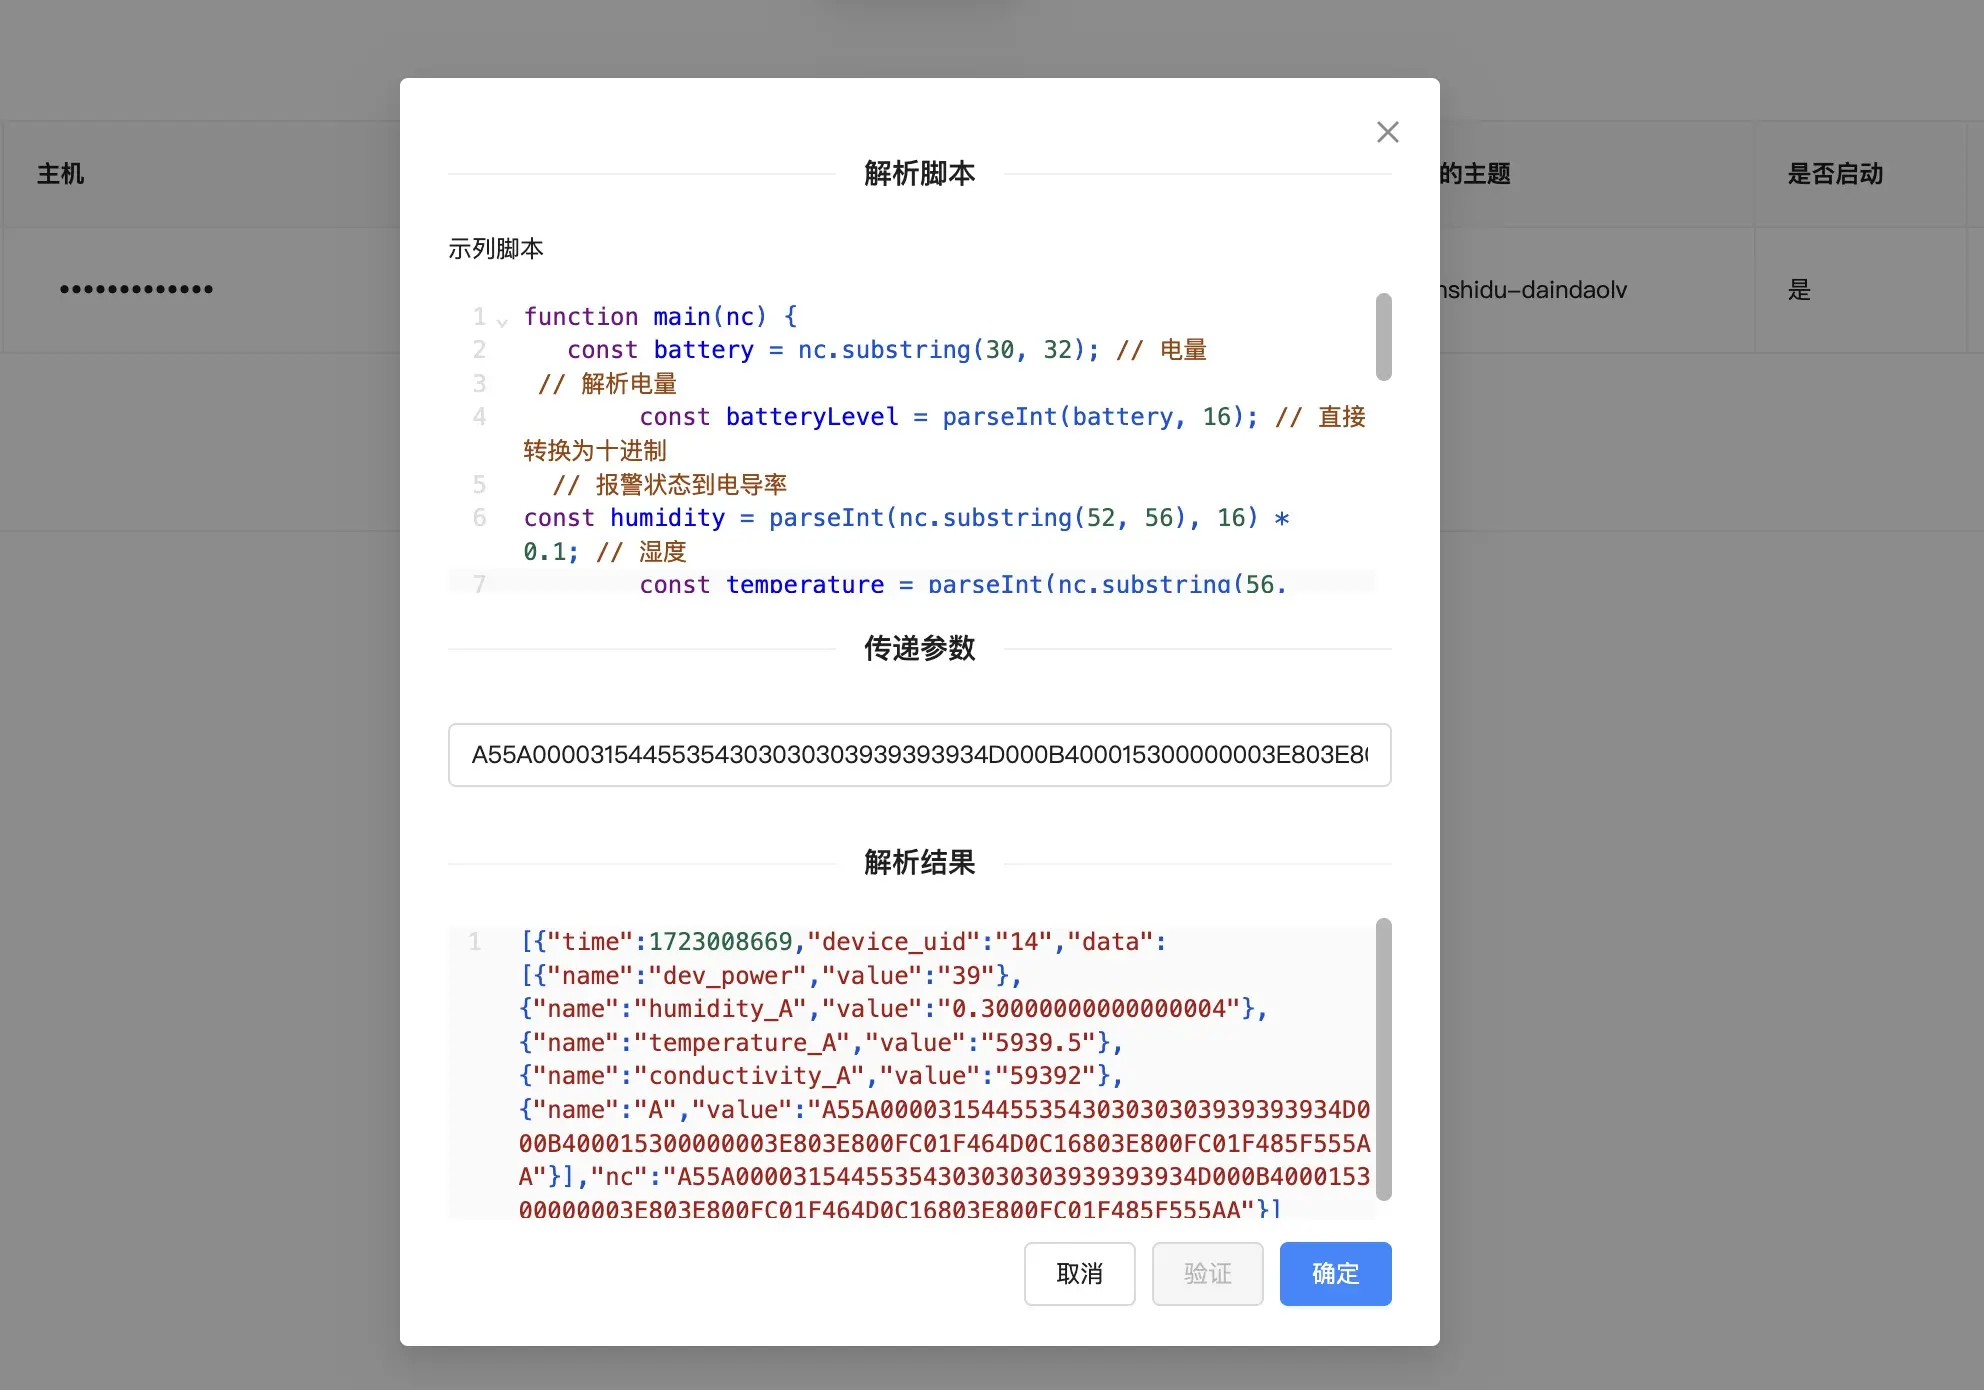
Taking the temperature and humidity conductivity sensor as an example, the device reports the original signal as: A55A00003154455354303030303939393934D000B400015300000003E803E800FC01F464D0C16803E800FC01F485F555AA
Example of Data Parsing Script:
function main(nc) {
   // Parse battery level
   const battery = nc.substring(30, 32); // Battery level
   const batteryLevel = parseInt(battery, 16); // Convert to decimal
   // Parse humidity, temperature, and conductivity
   const humidity = parseInt(nc.substring(52, 56), 16) * 0.1; // Humidity
   const temperature = parseInt(nc.substring(56, 60), 16) * 0.1; // Temperature
   const conductivity = parseInt(nc.substring(60, 64), 16); // Conductivity
  var dataRows = [
    { "Name": "dev_power", "Value": battery },
    { "Name": "humidity_A", "Value": humidity},
    { "Name": "temperature_A", "Value": temperature},
    { "Name": "conductivity_A", "Value": conductivity},
    { "Name": "A", "Value": nc },
  ];
  var result = {
    "Time":  Math.floor(Date.now() / 1000),
    "DataRows": dataRows,
    "DeviceUid": "14",
    "Nc": nc
  };
  return [result];
}
Execution Steps
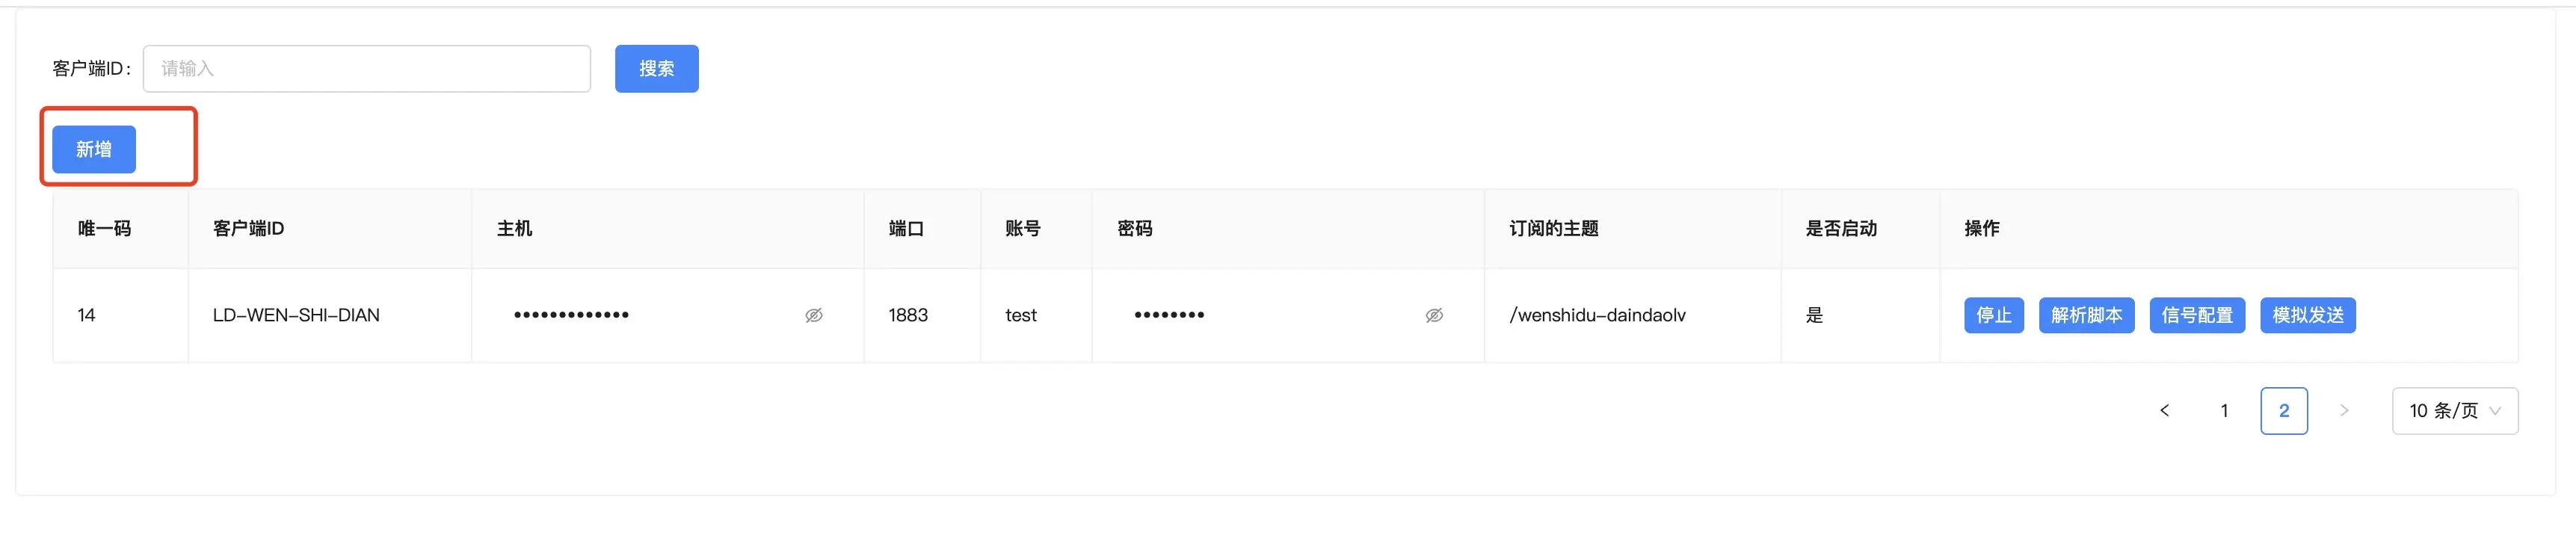
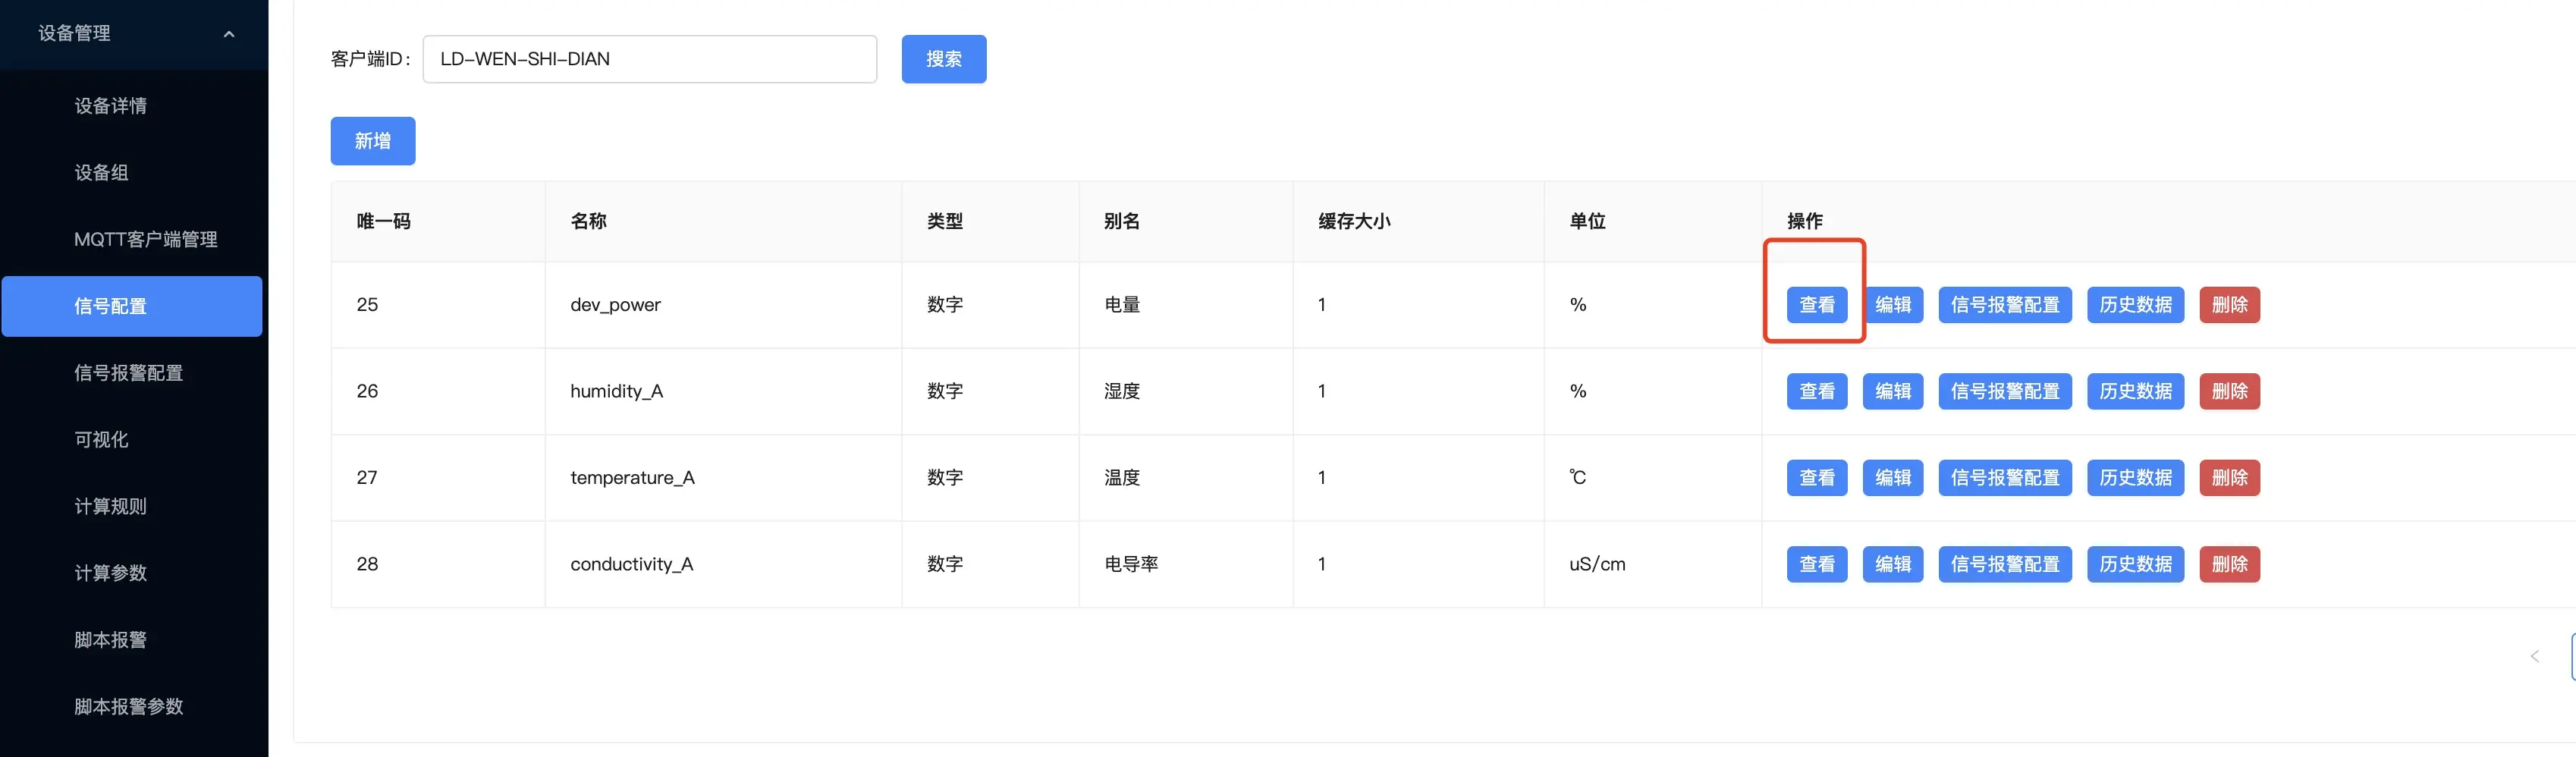
- Add a new client device in the MQTT client management, and configure the MQTT server address, port, username, password, and other parameters.
- After the script configuration is completed, verify whether the script is parsed correctly.
- After the signal value configuration is completed, click the Save button in the MQTT client management to save the configuration.
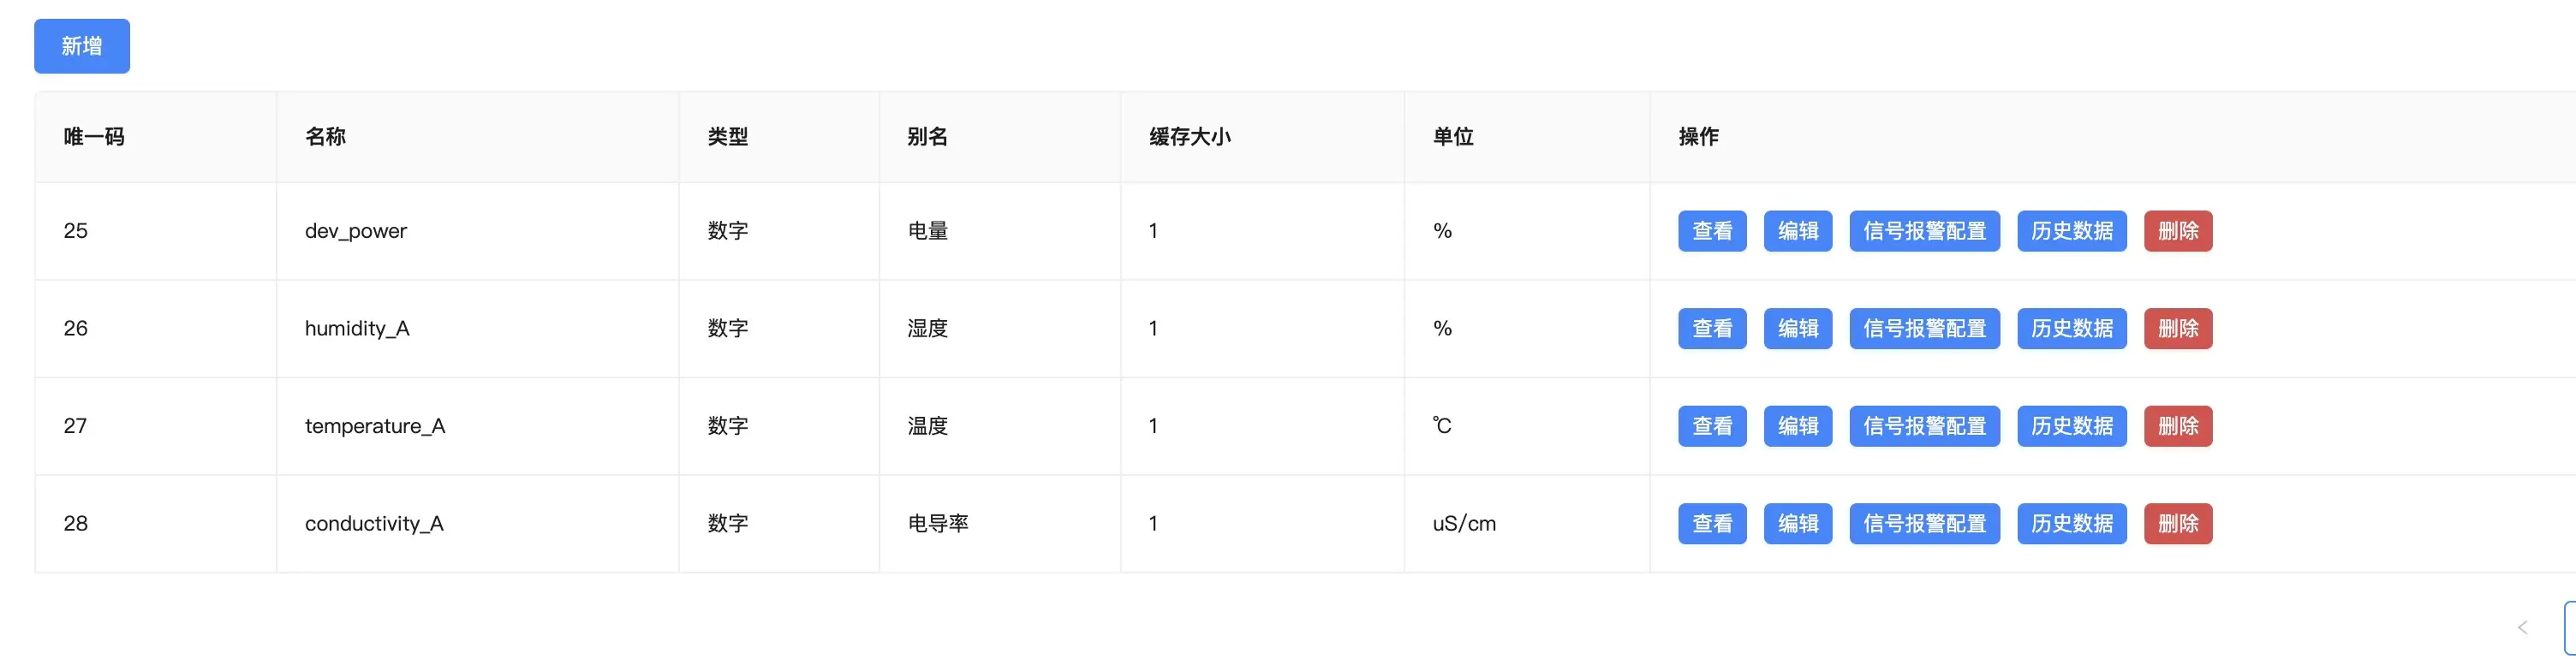
⚠️: The names of the signal values in steps 2 and 3 must be consistent with the names in the dataRows of the parsing script, otherwise the data cannot be parsed.
- After the signal value configuration is completed, click the Start button in the MQTT client management to start the client device.
- Click to simulate sending test data to send simulated data to the MQTT server.
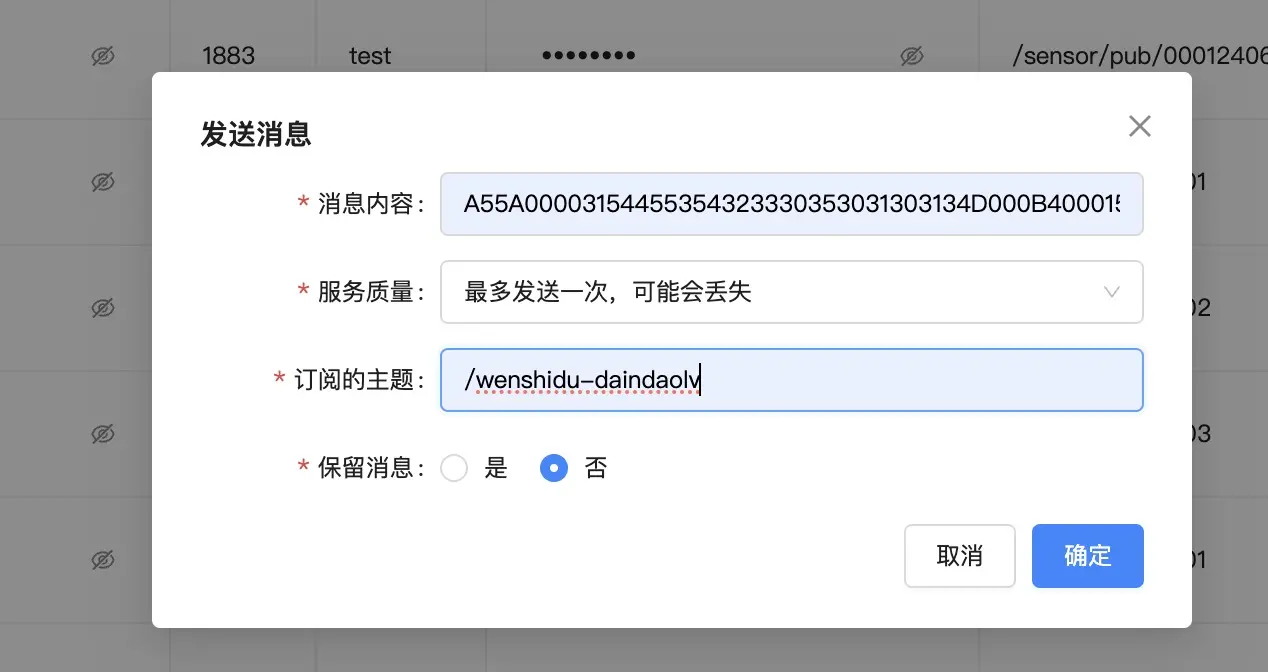
- Check whether the data is received. If the data is received, the configuration is successful.
Temperature and Humidity Conductivity Analysis
Execution Steps
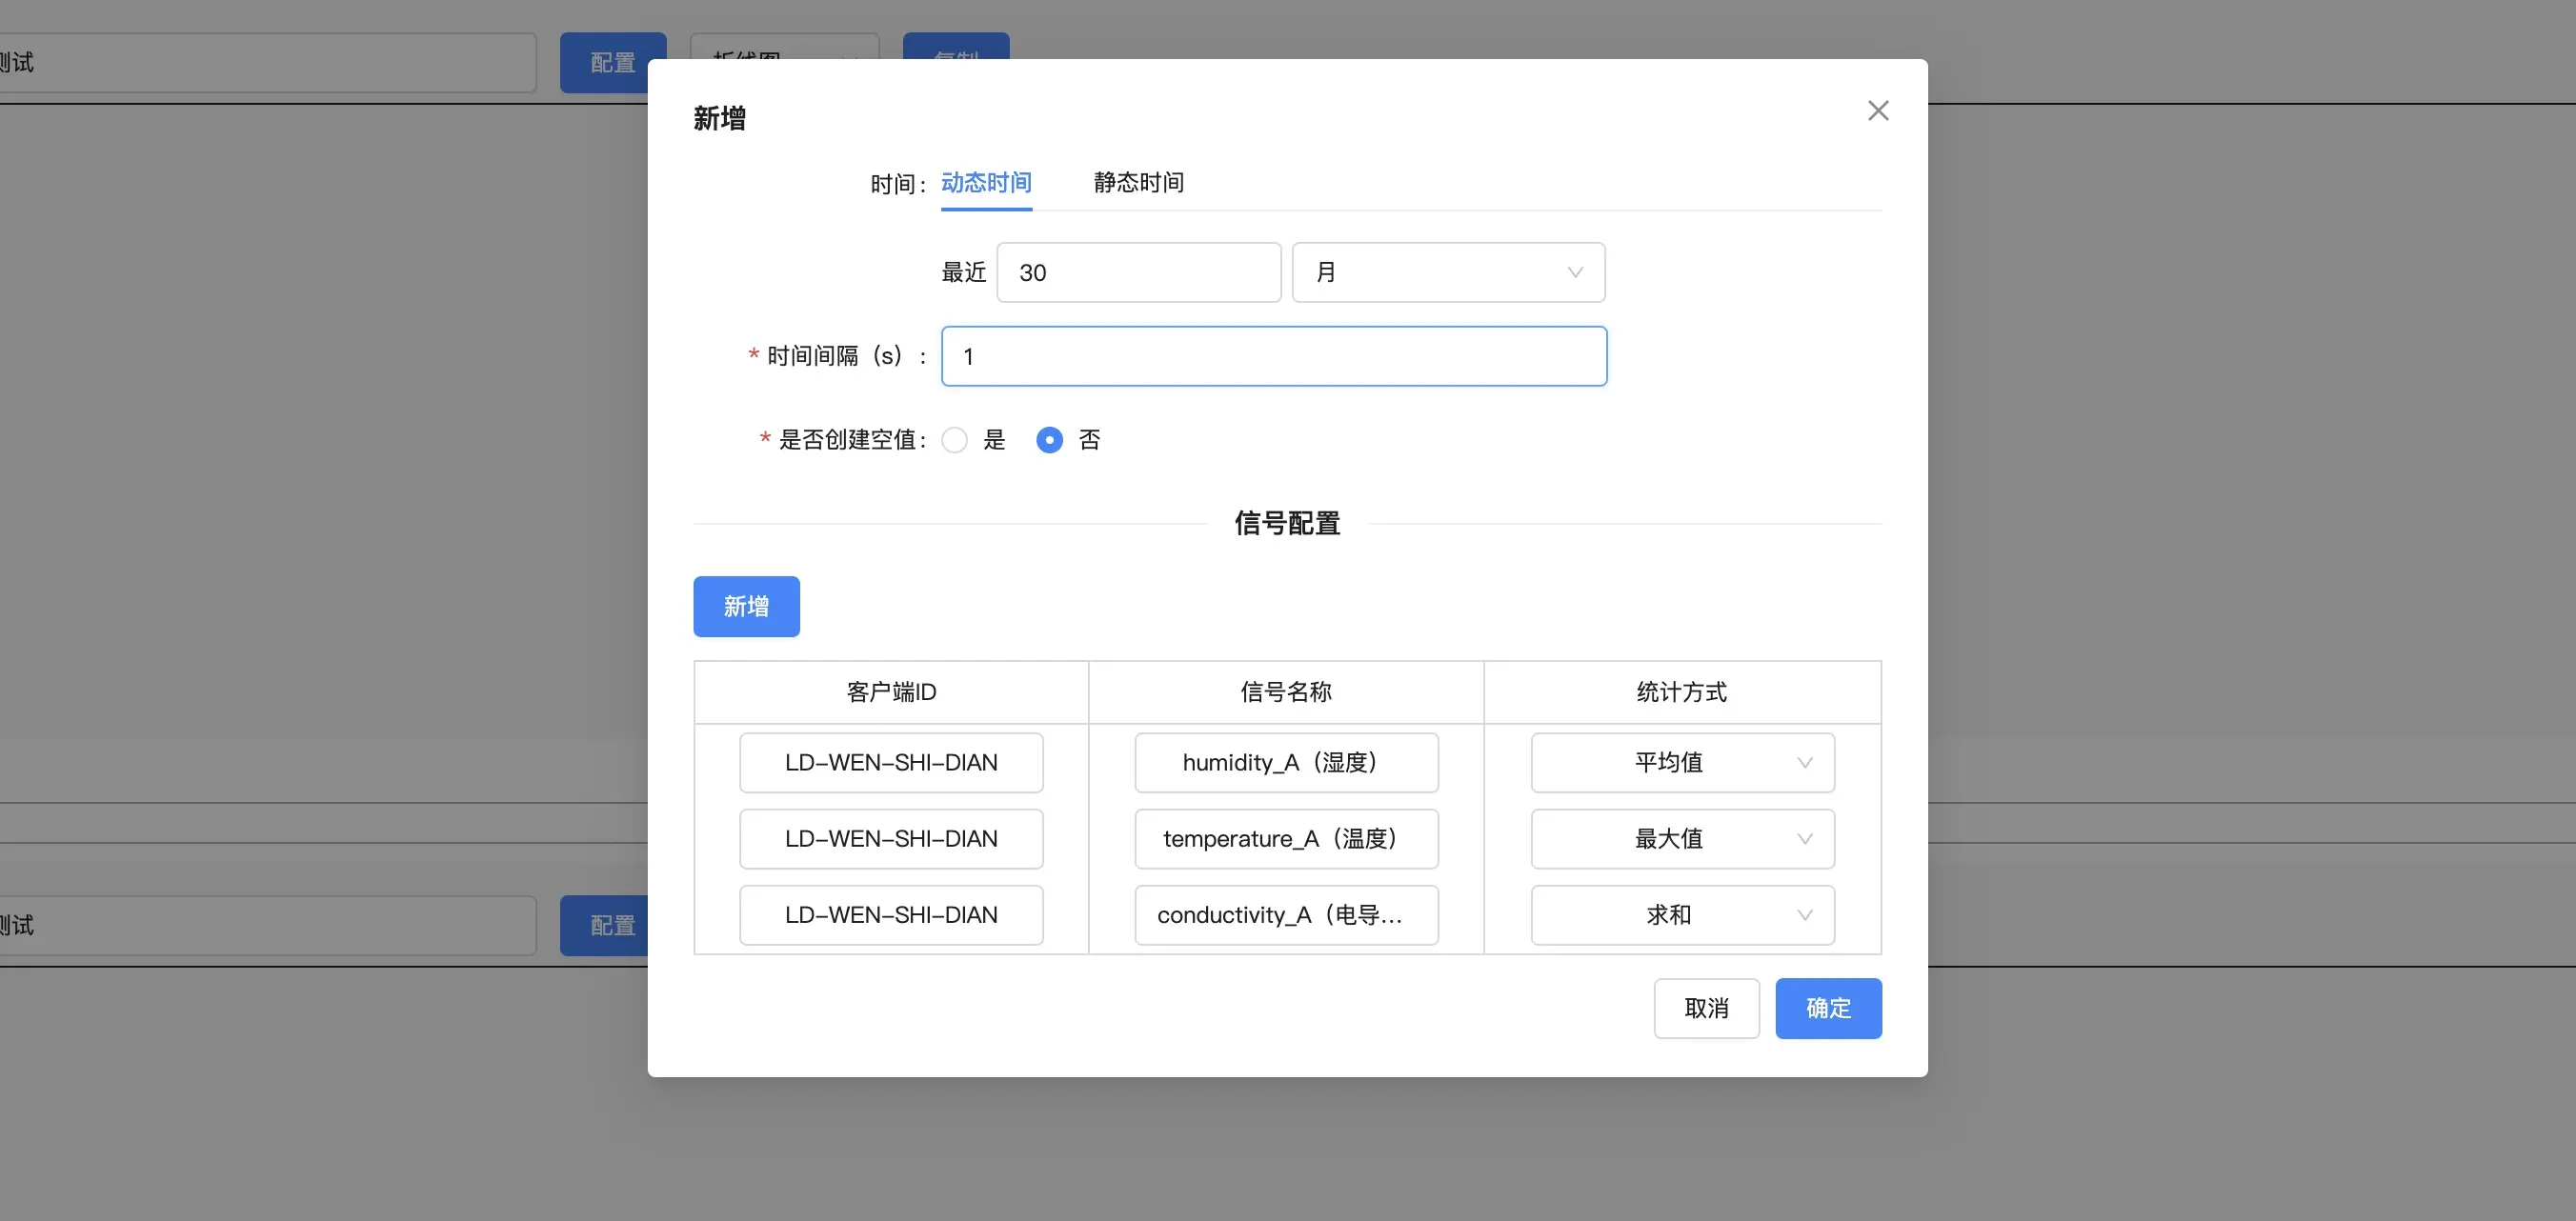
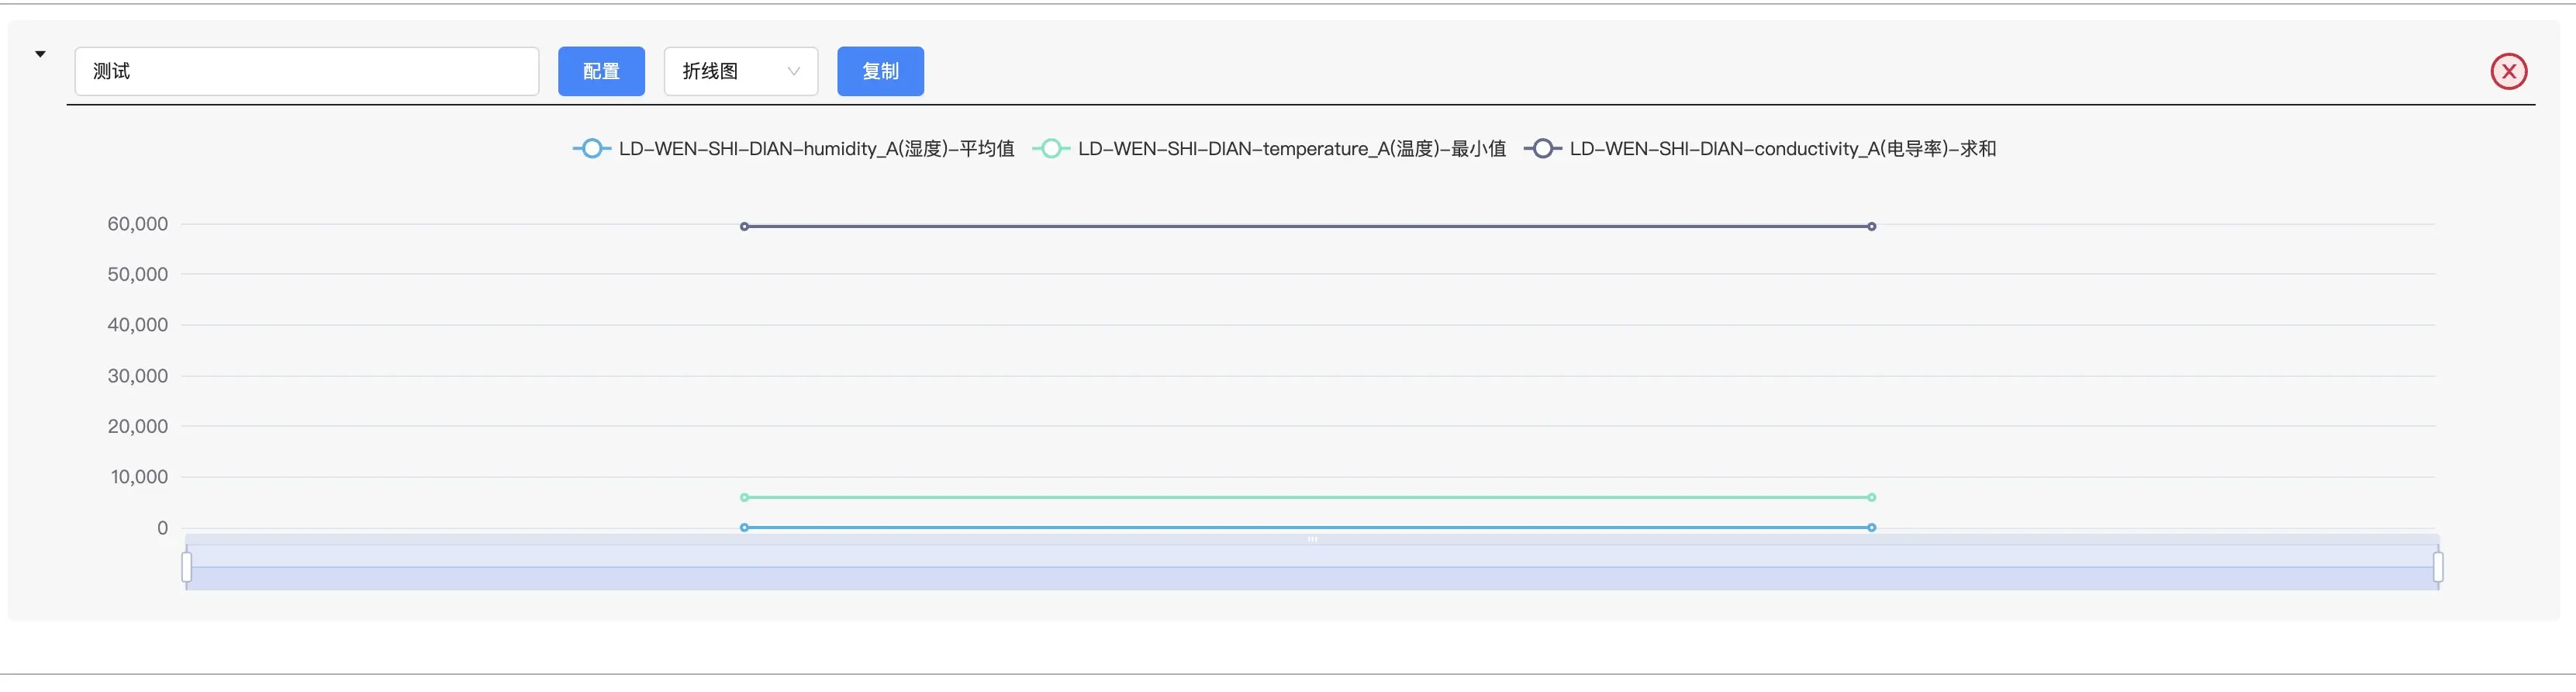
- In the visualization panel, click the Configure button, select the Line Chart/Bar Chart template, and configure the template name, time: dynamic time or static time, signal value configuration, and other parameters.
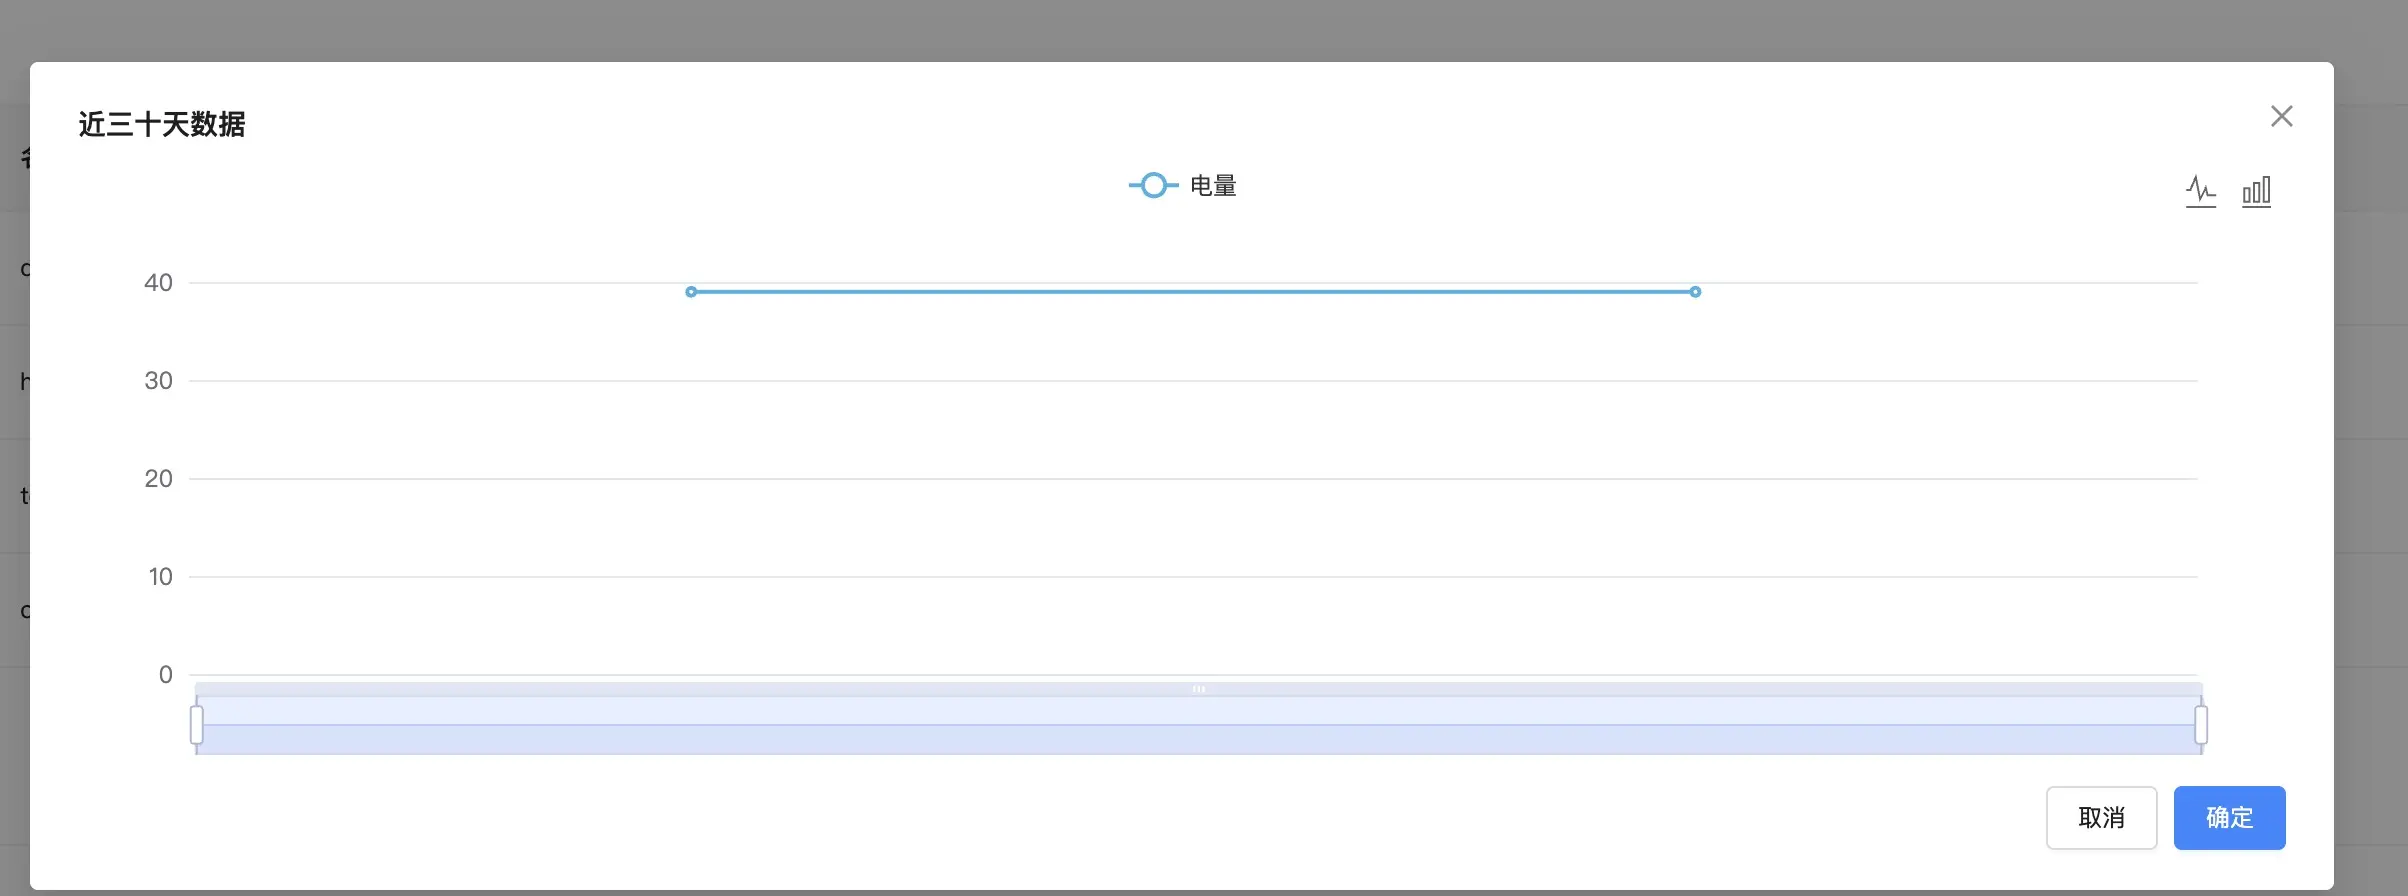
- According to the statistical results, the data of the temperature and humidity conductivity sensor can be analyzed, which can effectively analyze and optimize the data of the temperature and humidity conductivity sensor, thereby improving the efficiency of agricultural production and the quality of crops, such as:
Anomaly Detection
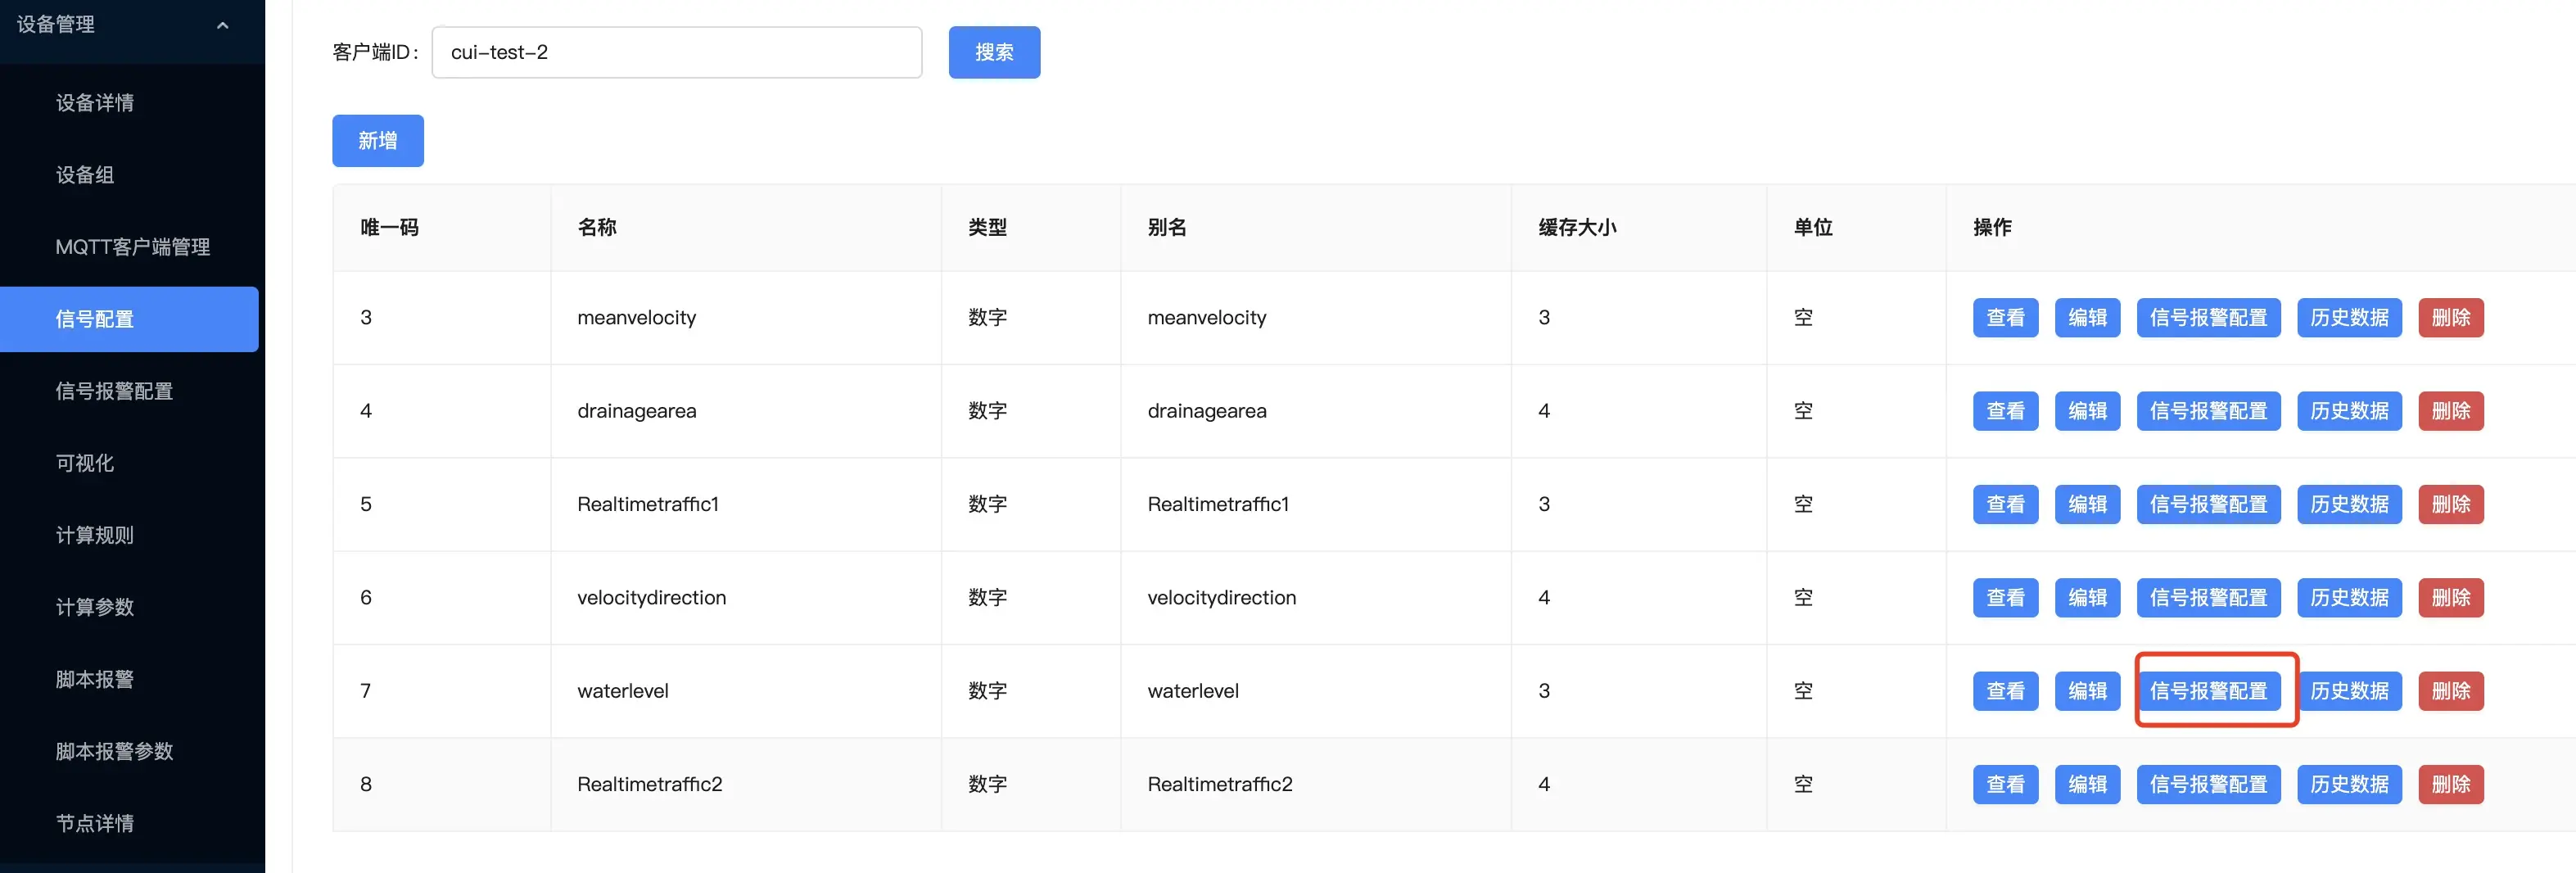
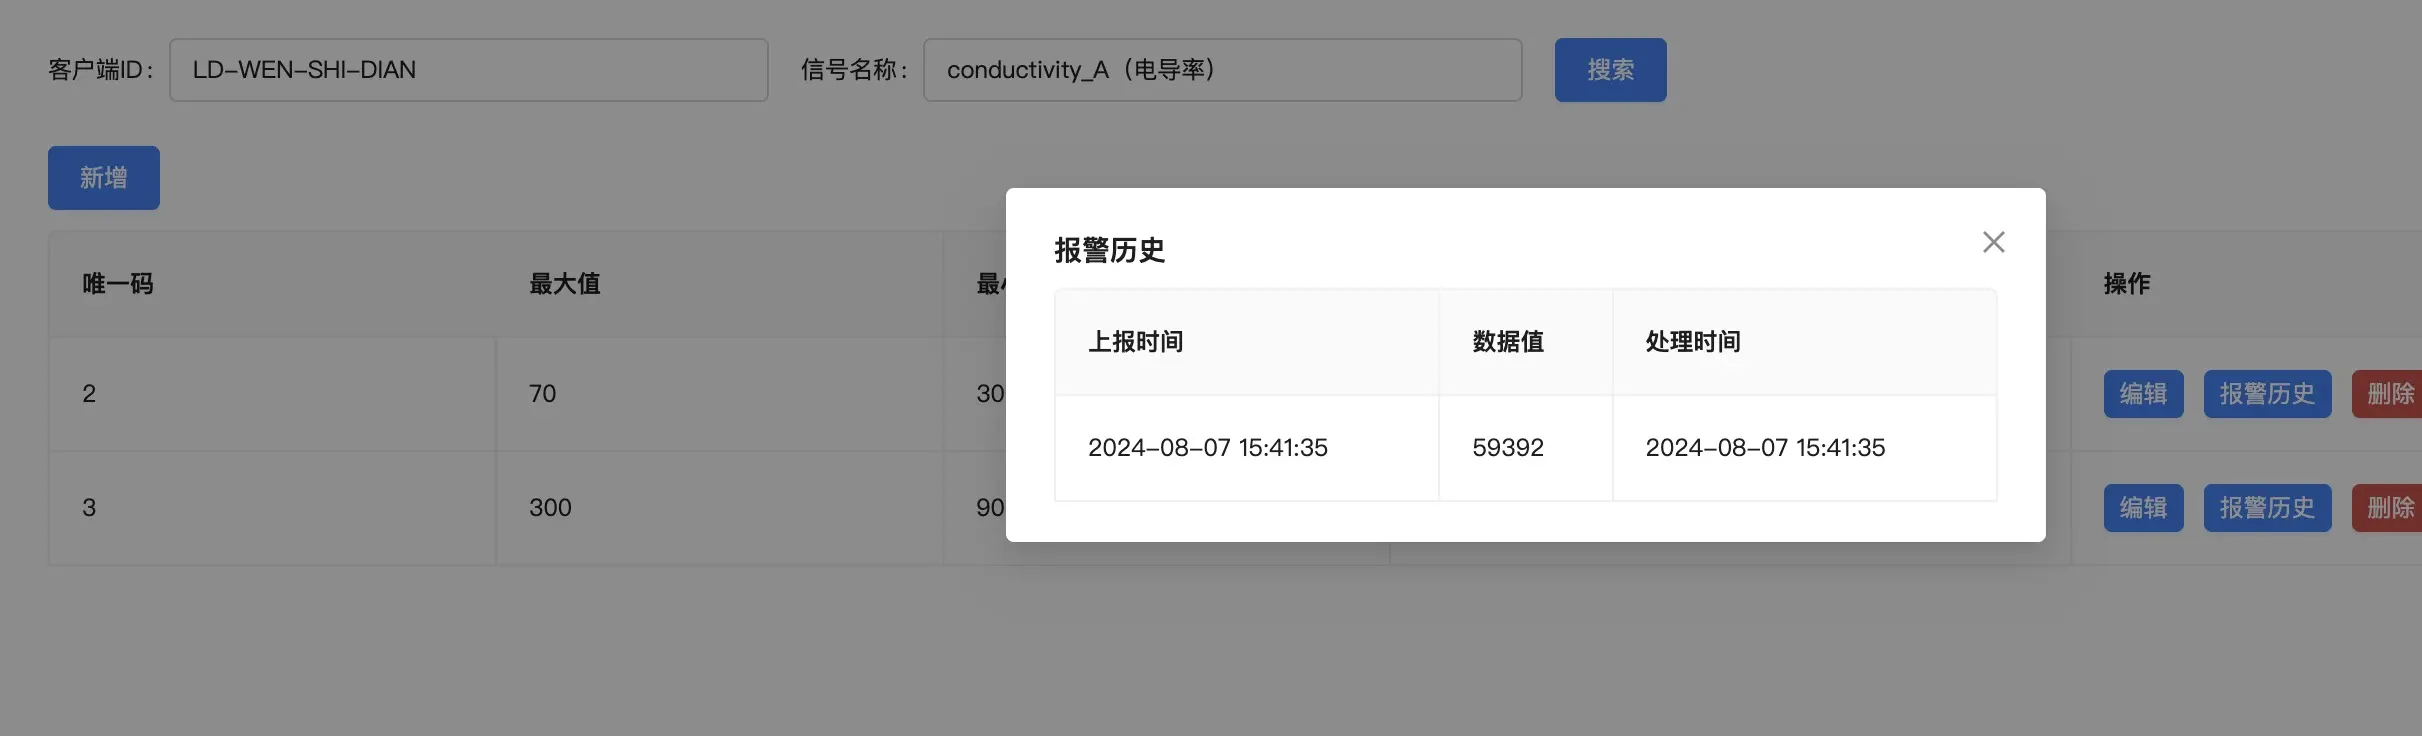
Signal Value Alarm Configuration
- In the signal configuration, click the Signal Value Alarm Configuration button to configure the threshold for a single target value.
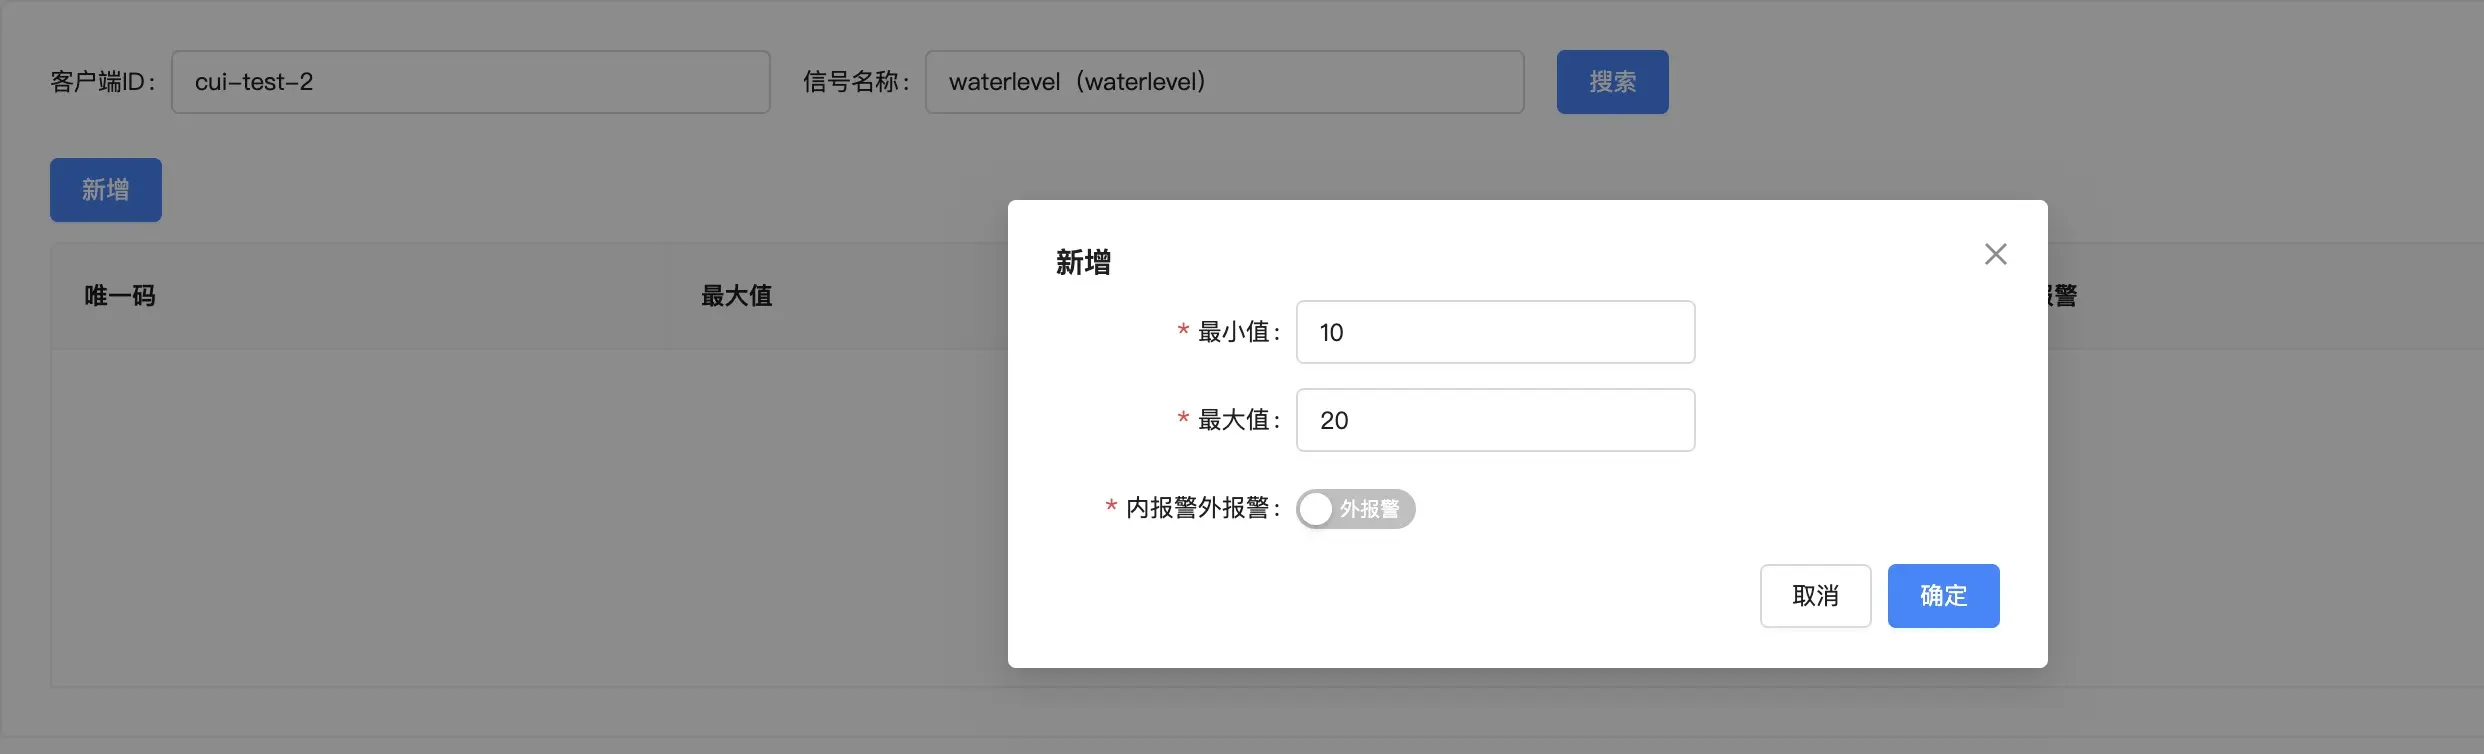
- Configure the threshold, and multiple range values can be configured, such as:
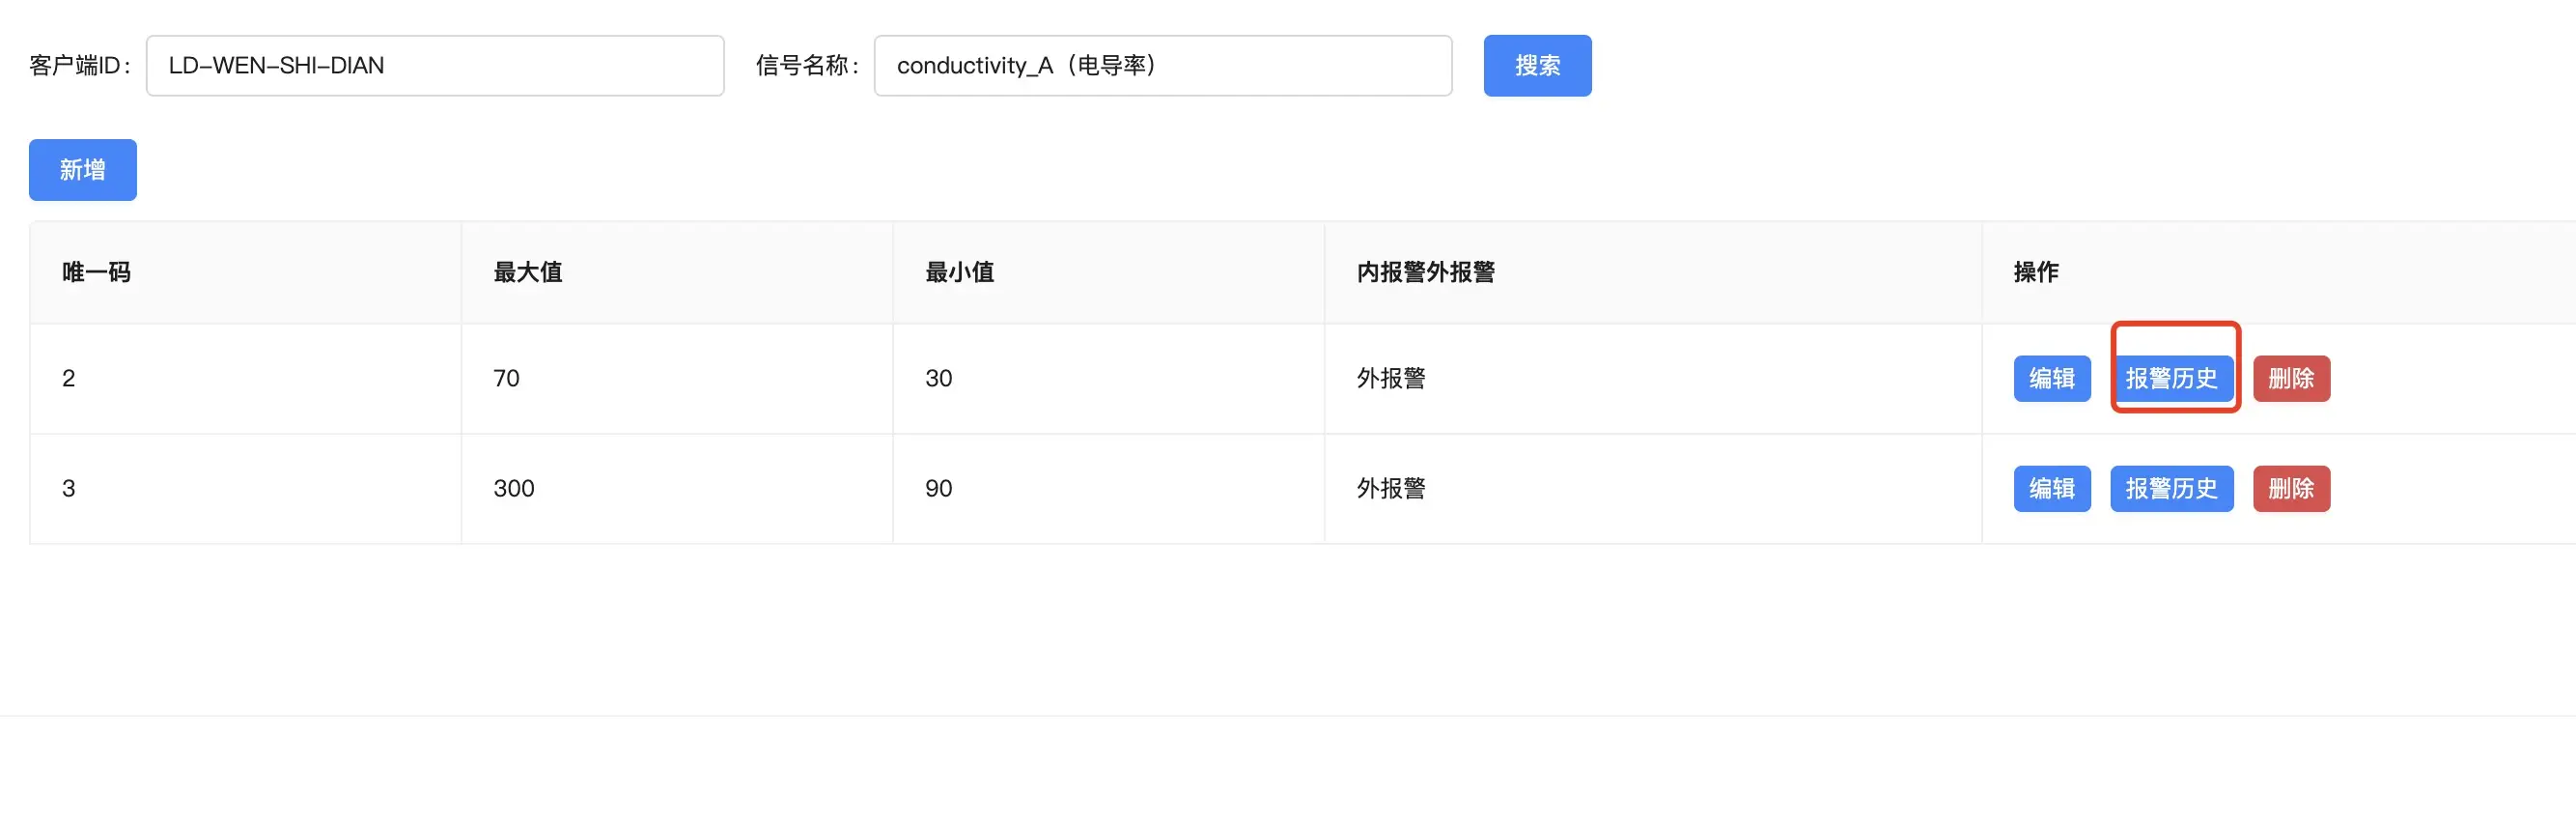
- Query the hit results, and the alarm results can be queried in real-time.
Alarm Script Configuration
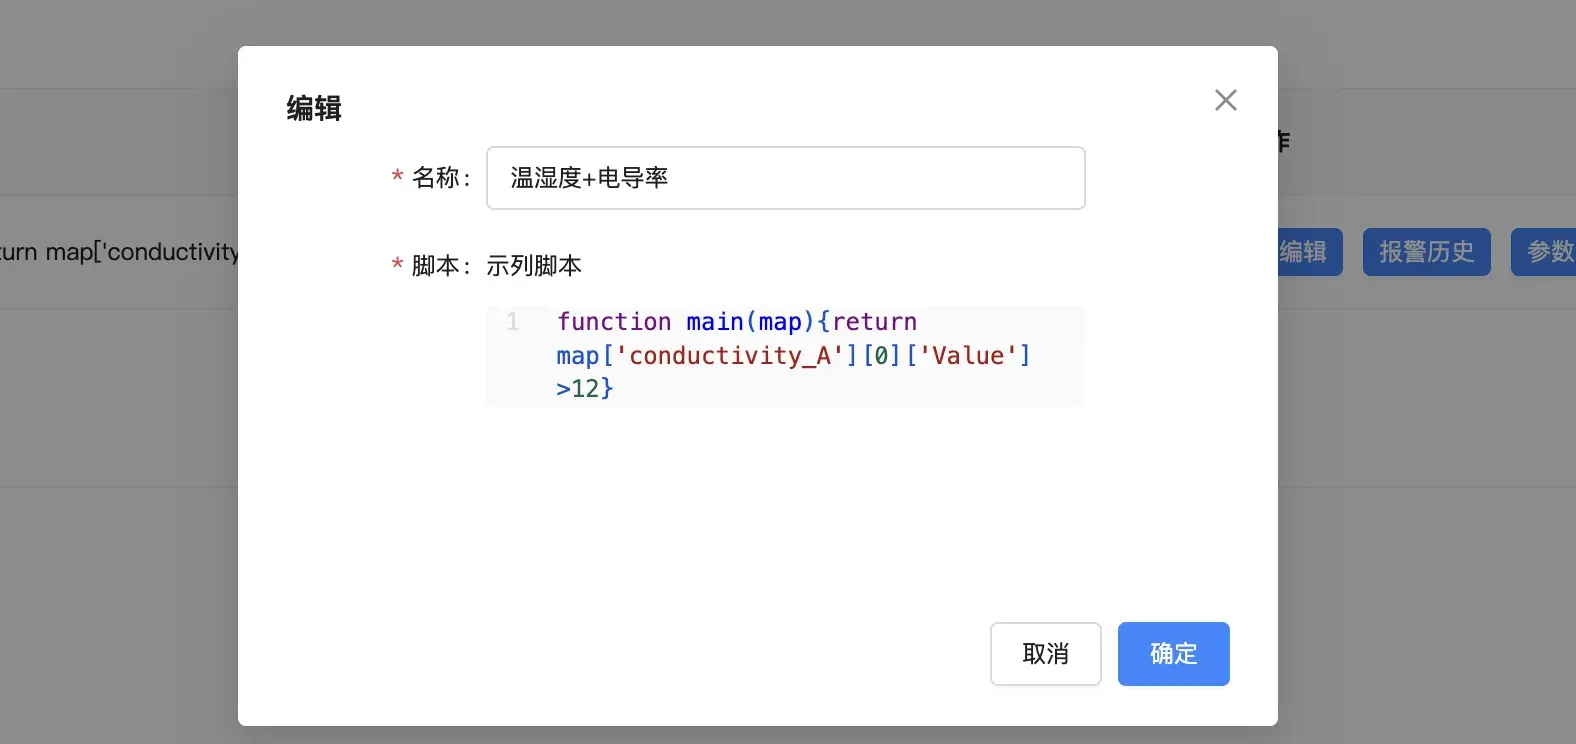
- In the script configuration, click the Add button to add a script, and customize your alarm rules to be more flexible and controllable.
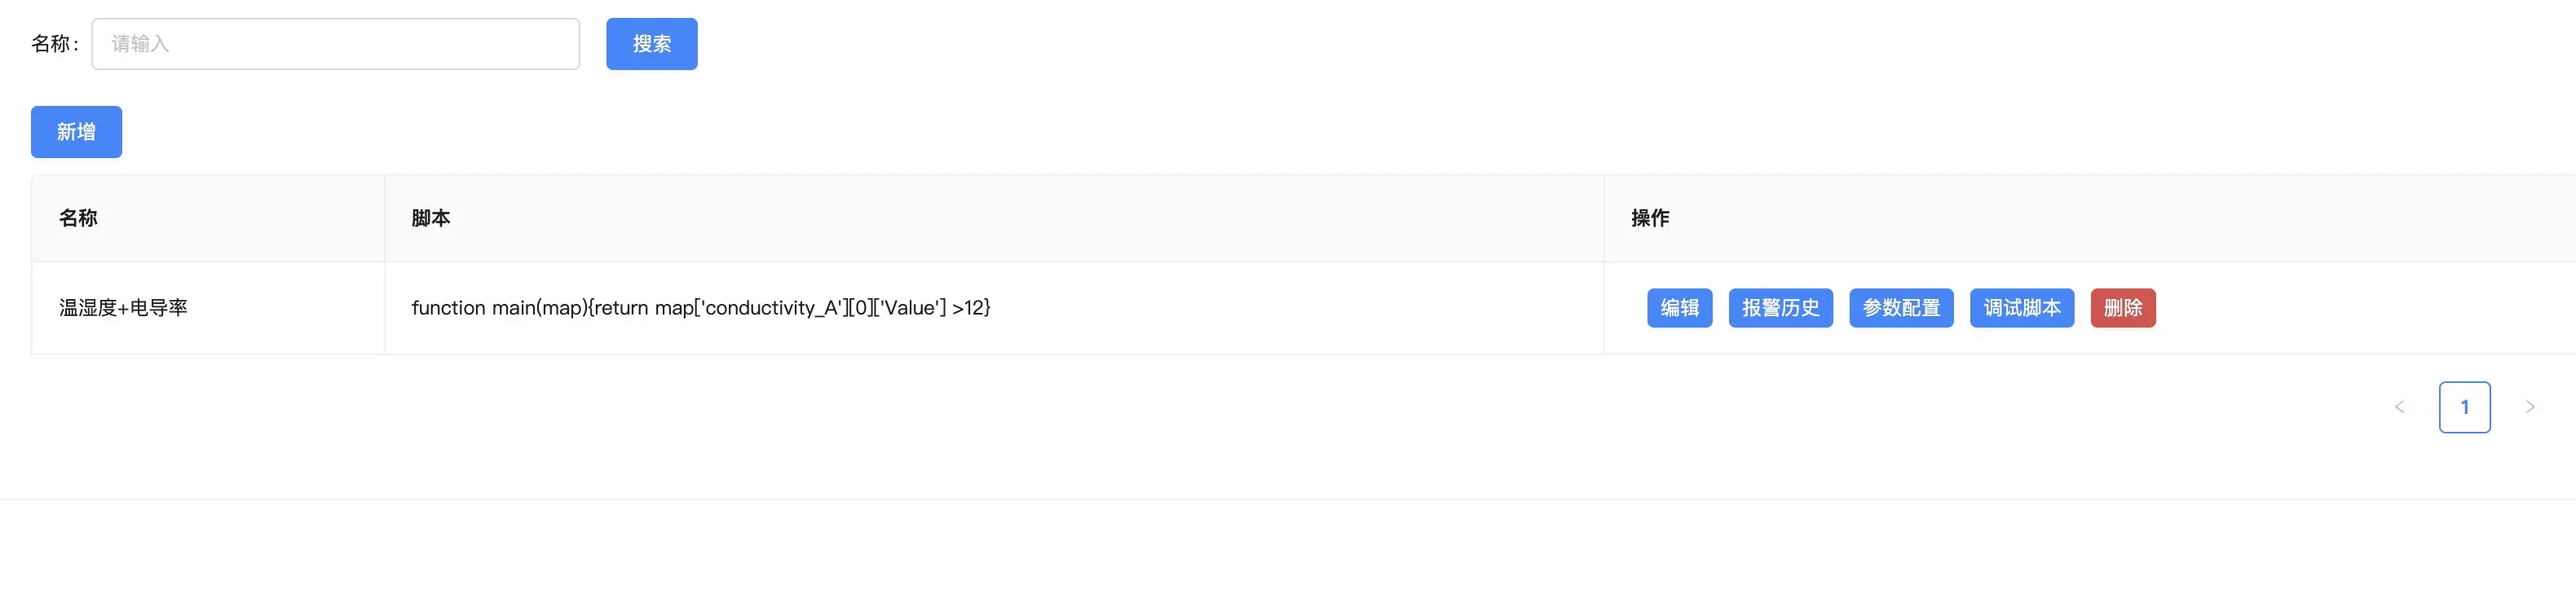
- Example of alarm script writing: