· Zen HuiFer · Case · 需要3 分钟阅读
Elevator Monitoring
This article details the key indicators, statistical schemes, and application scenarios of elevator monitoring. By monitoring the operating status, energy consumption, vibration, door opening and closing time, running speed, and temperature of the elevator, faults can be detected in time to ensure the safe and efficient operation of the elevator.

IoT Elevator Monitoring
Monitoring Indicators
- Elevator operating status: standby, running, maintenance, abnormal stop
- Energy consumption
- Cabin vibration
- Elevator door opening and closing time
- Running speed and position
- Temperature monitoring inside and outside the elevator
Statistical Scheme
- Operating status chart by time dimension, observing the operating status of the elevator at specific time points
- Energy consumption by time dimension
- Vibration chart
- Temperature monitoring chart
Application Scenarios
Temperature and vibration can be used as part of the reference conditions for maintenance
- If the vibration amplitude and frequency exceed the expected value, on-site inspection is required
- Cabin temperature can be used as a comfort indicator, adjusting to a suitable value can save some resources
- Machine temperature monitoring can be used as an operating indicator. If the machine temperature is not ideal, adjustments can be made in conjunction with the cabin temperature, saving resources in the cabin for use on the machine
Running speed and position, and elevator door opening and closing time
- Observe whether there are problems such as abnormal descent or slow ascent to eliminate safety hazards
- Long door opening times can also cause resource waste and scheduling issues
Elevator operating status
- Operating status monitoring
- In addition to normal operation detection, peak usage times of the elevator can also be analyzed
- If the elevator equipment supports it, different scheduling measures can be taken during peak times to improve user satisfaction
- Advertising can be charged according to peak gradients
Implementation Process
- Indicator parameter design
- Elevator operating status
- Standby 0
- Running 1
- Maintenance 2
- Abnormal stop 3
- Energy consumption
- 123.45 kwh
- Cabin vibration
- Vibration amplitude 0.2 m
- Vibration frequency 5 Hz
- Running speed and position
- Speed 1.2 m/s
- Position 5th floor or height 15 m
- Temperature monitoring inside and outside the elevator
- Cabin temperature 25 degrees Celsius
- Outside cabin temperature 30 degrees Celsius
- Elevator operating status
- Data calculation
- Charts
- Indicator parameter design
Configuration Example
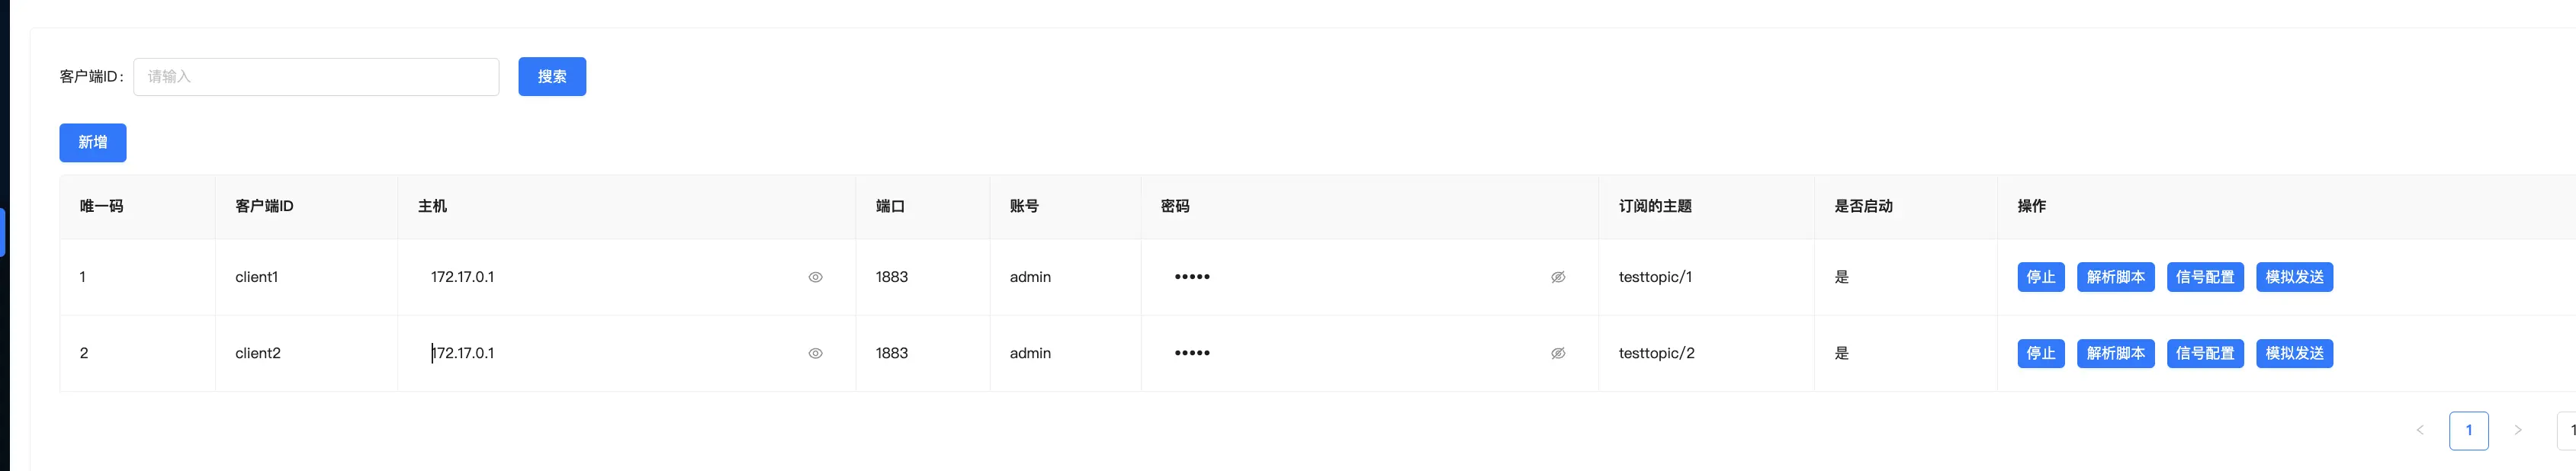
First, add clients as shown in the figure. Client 1 is responsible for parsing the status and temperature of the device, and Client 2 is responsible for parsing the vibration frequency and amplitude of the device
The parsing script is as follows
Client 1 (Device 1 supports sending two indicators: status and temperature)
function main(nc) {
    const data = JSON.parse(nc)
    var dataRows = [
        { "Name": "dfStatus", "Value": data.sta },
        { "Name": "dfTemperature", "Value": data.tp },
    ];
    var result = {
        "Time":  Math.floor(Date.now() / 1000),
        "DataRows": dataRows,
        "IdentificationCode": "1",
        "DeviceUid": "1",
        "Nc": nc
    };
    return [result];
}
Client 2
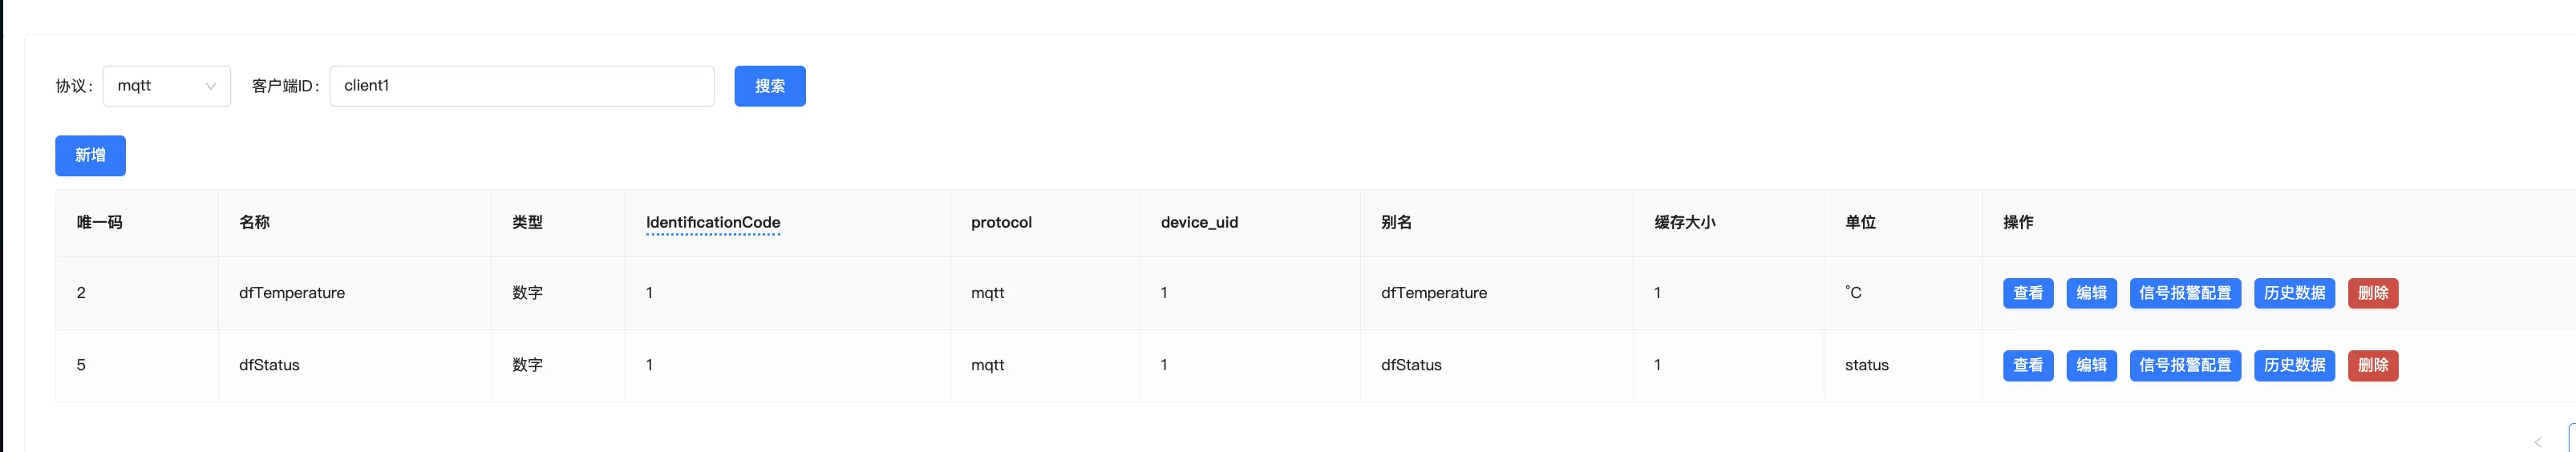
function main(nc) {
    var dataRows = [
        { "Name": "dtShockFrequency", "Value": parseInt(nc)/0.3},
        { "Name": "dtShock", "Value": nc }
    ];
    var result = {
        "Time":  Math.floor(Date.now() / 1000),
        "DataRows": dataRows,
        "IdentificationCode": "2",
        "DeviceUid": "2",
        "Nc": nc
    };
    return [result];
}
Configure signals to the corresponding two clients respectively
After simulating for a period of time, check the corresponding signal charts
Temperature chart
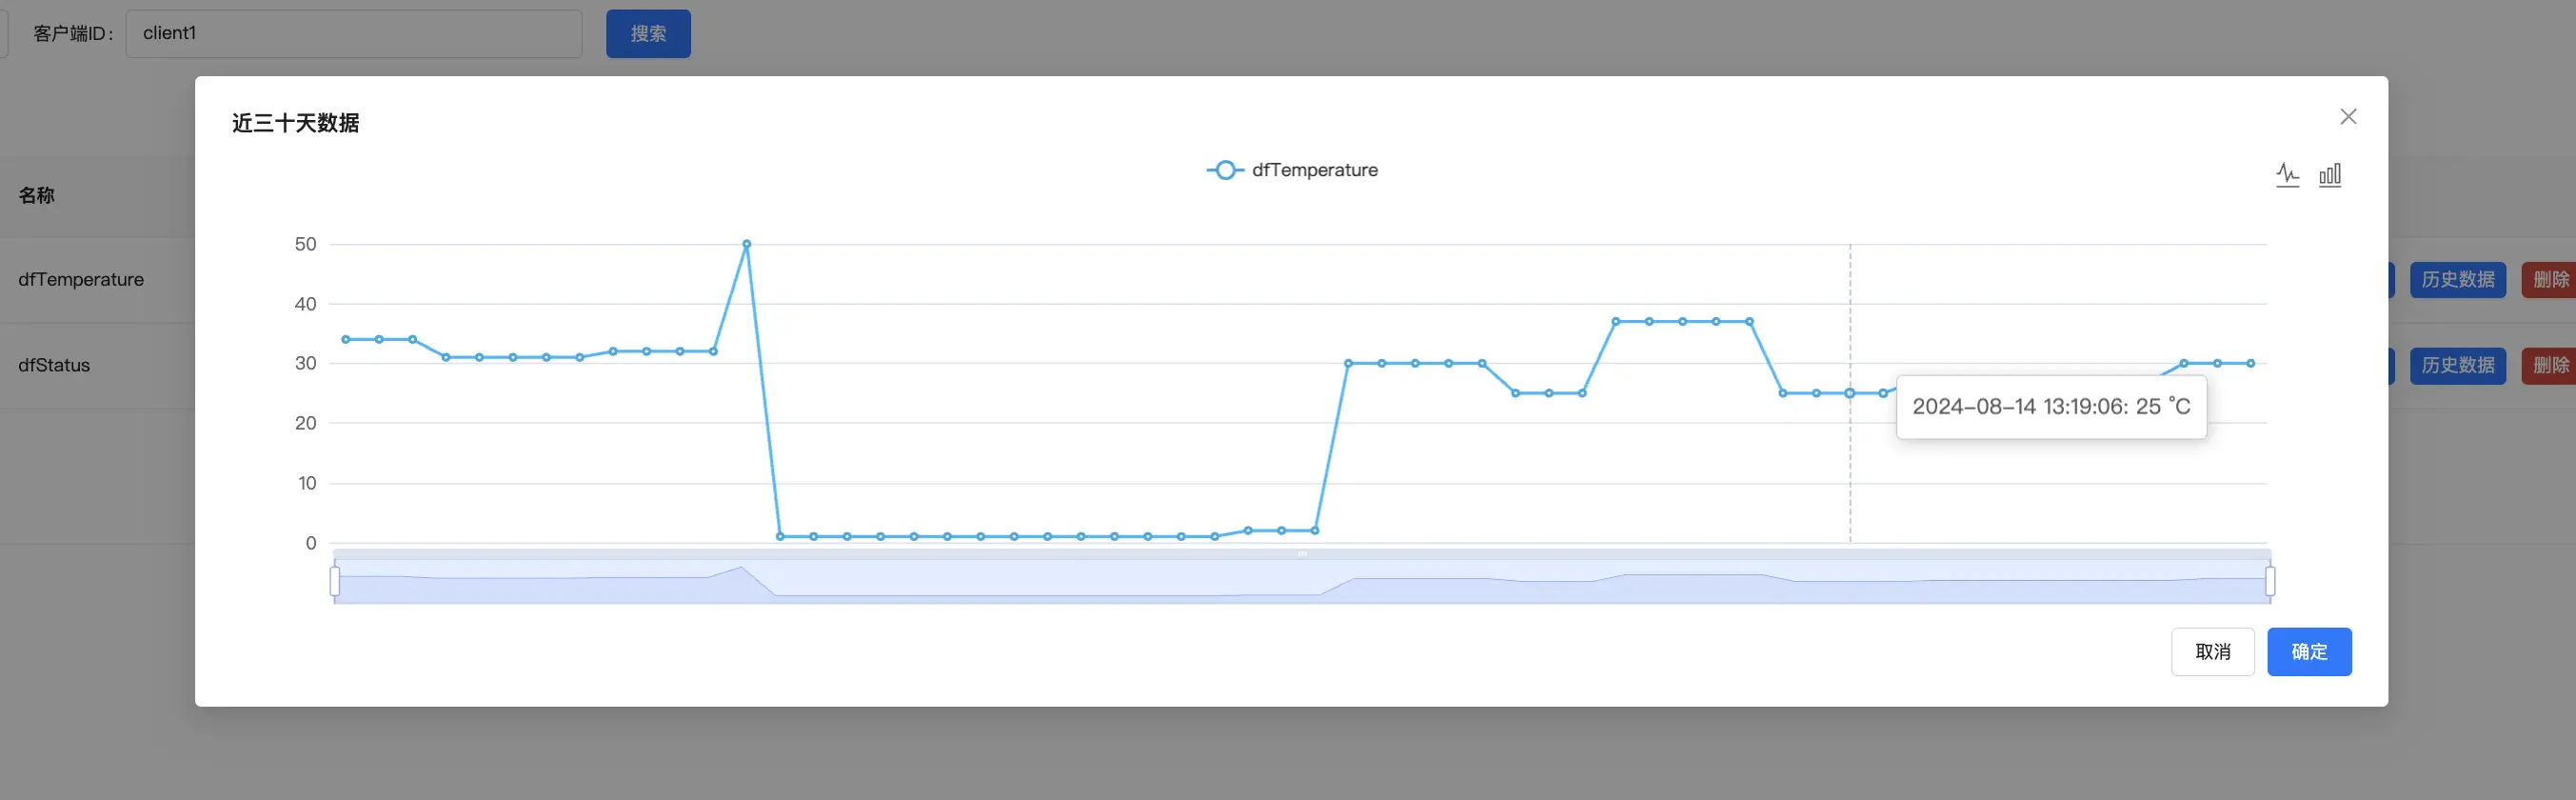
We defined the enumeration values of the status and temperature-related indicators above. The exaggerated data in the simulated data is to simulate the configuration or data anomalies of the sensor itself. After generating such data, it can also be used as a reference for elevator maintenance
Elevator status chart
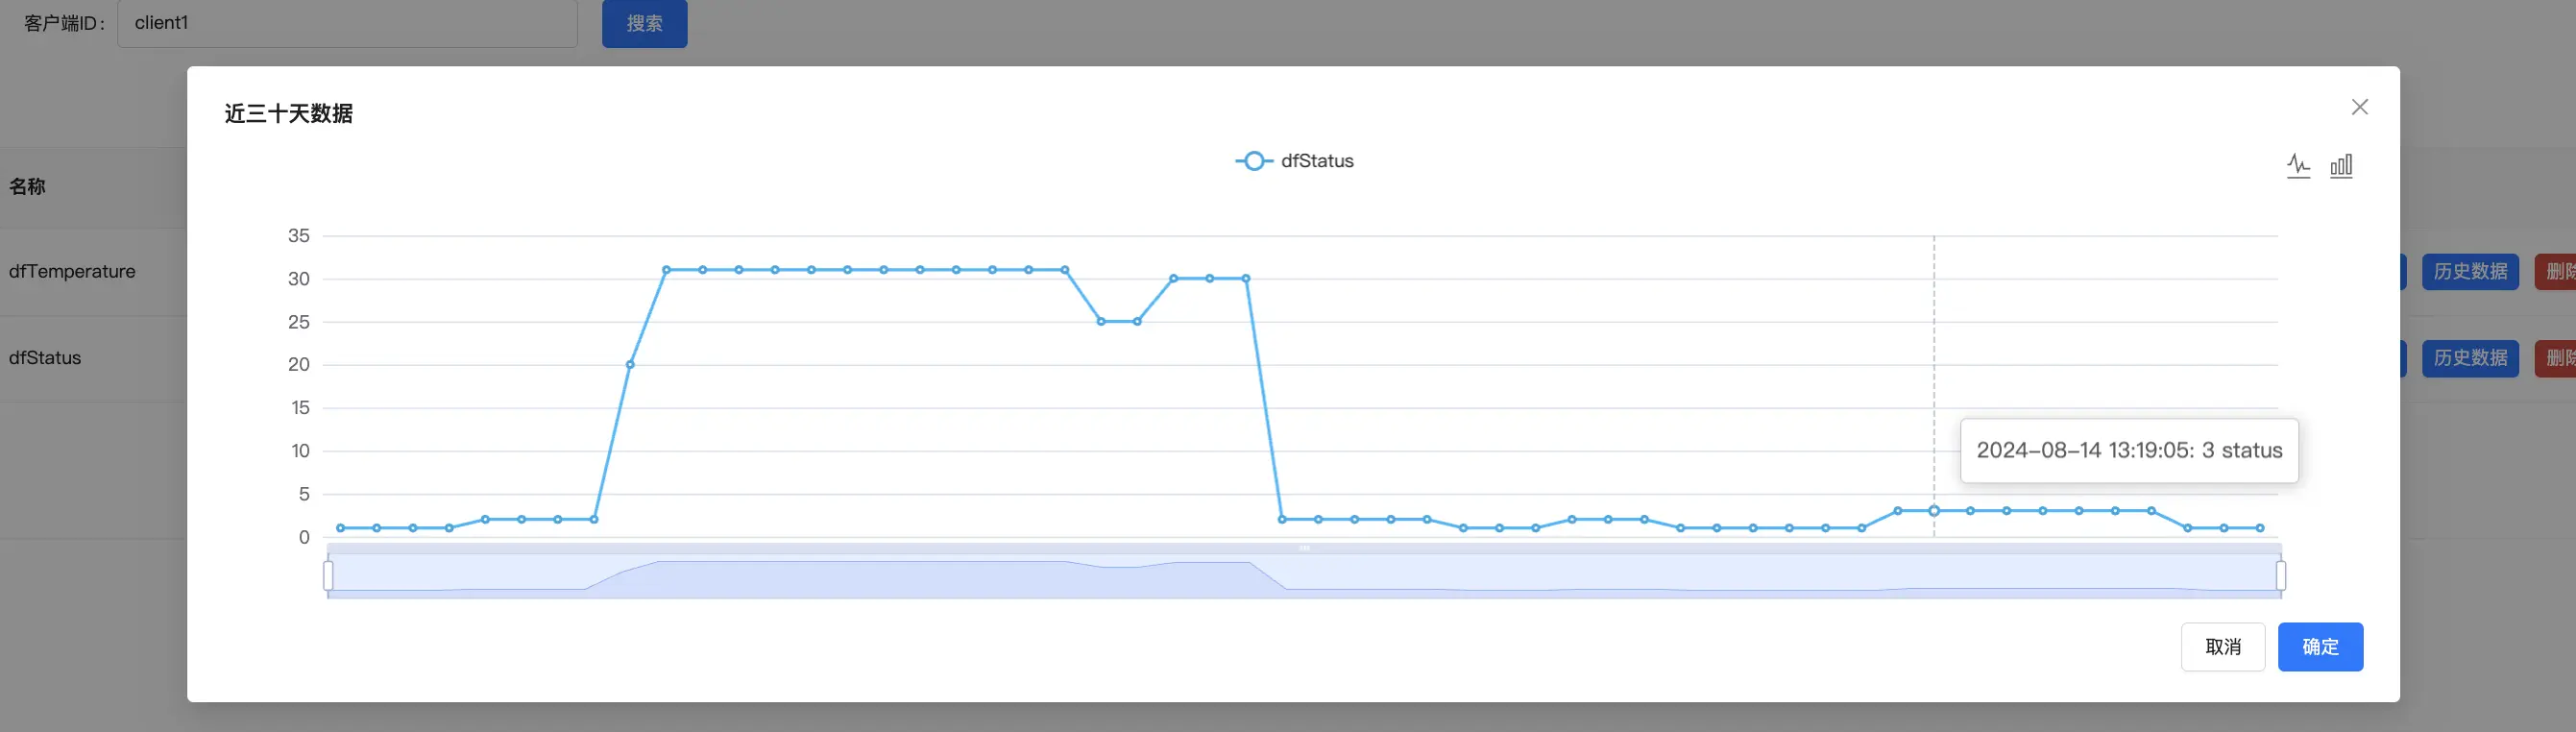
Analyzing the chart can observe the duration of abnormal elevator status, whether there is a long door opening situation, and the usage of the elevator
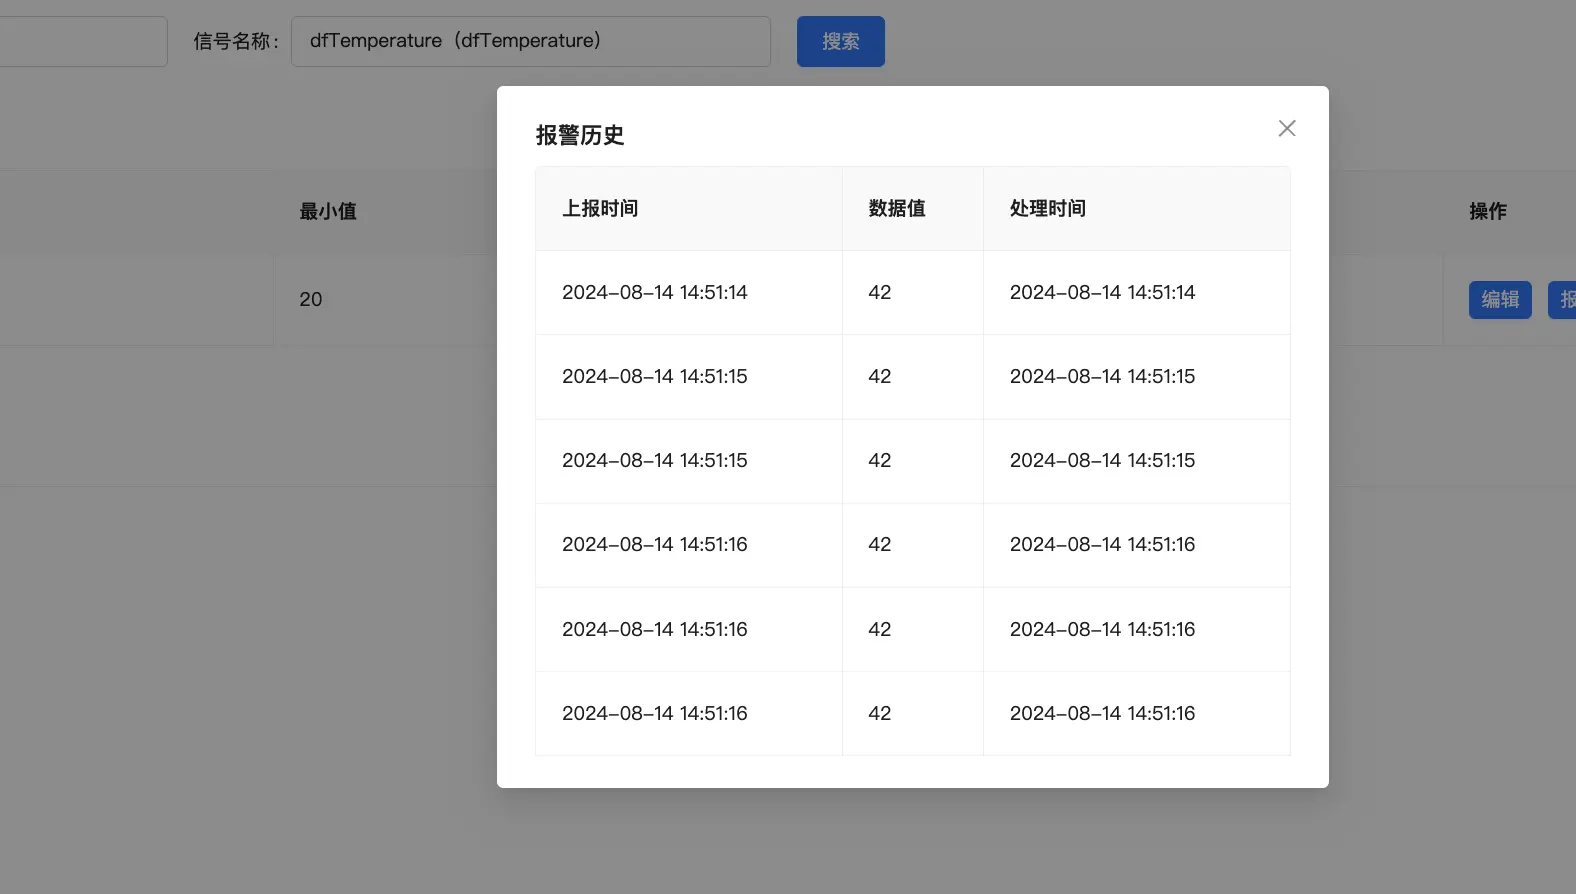
Configure temperature alarms
Assuming the normal working temperature of the elevator is 20-40 degrees Celsius, an alarm is generated if the signal value is outside the range
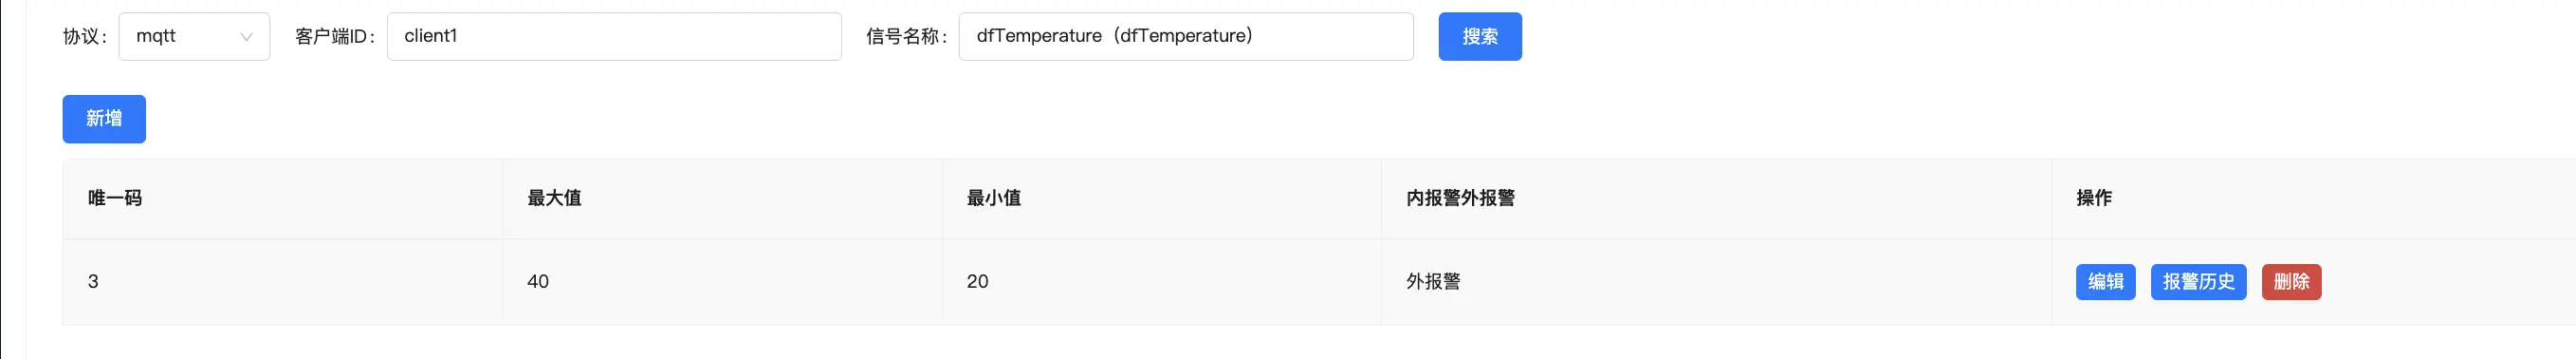
Generate alarm history after exceeding the corresponding range value